On June 20, the second issue of Jeff Clark Trader went out to my subscribers. The following morning, we made a call option trade on Applied Optoelectronics (AAOI).
If you’re a subscriber, I hope you made that trade.
Because less than a week later, on June 27, we sold half our position for a 122% gain.
Today I’ll show you how…
Before we get to that, though, I want to address a relevant question that was sent in from a subscriber…
I would like to better understand Jeff’s thinking in choosing AAOI as one of the three equities (along with GDX and M) to trade in the Jeff Clark Trader service. It is a small-cap stock with relatively large increments between strike prices.
Furthermore, the price trend has been consistently down over the past year which would not seem to make it a good candidate for bullish trades like buying calls as Jeff recently recommended. A little more explanation of the reasoning for including AAOI in the trading mix would be helpful. Thanks.
– Jeff N. (Jeff Clark Trader and Delta Direct subscriber)
Hi Jeff. Thank you for your question, and for being a subscriber. As I mentioned in my 3-Stock Retirement Blueprint, just about any three stocks you can think of will fit this strategy. (Subscribers can access the blueprint here.)
Because it’s not about the stocks. It’s about the strategy.
AAOI consistently produces the sort of trading patterns I tend to look for (GDX as well). And, that will give us the opportunity to trade it several times each year. It doesn’t matter if the pattern is bearish, bullish, or consolidating – just so long as those patterns appear clearly throughout the year.
As you point out, AAOI has been falling for most of the past year. But, the recent setup showed the potential for an intermediate-term shift from a bearish trend to a bullish trend. And, we happened to catch that shift at just the right time.
Let me also address the increments between strike prices. There are a number of factors that play into which strike prices are available to trade on options – the primary ones being the popularity of the options and volume of contracts traded. That’s the main reason why the AAOI options with later expirations have $2.50 increments, while the more recent strike prices are in $0.50 increments.
But, really, the technical picture on AAOI was the main reason I chose it.
Take a look at this daily chart of AAOI – the same one I sent to subscribers last week…
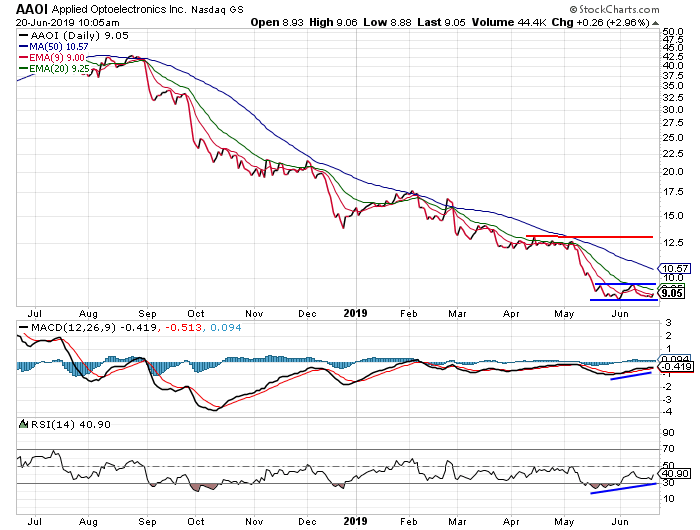
AAOI was in a strong downtrend for all of the past year. The stock had fallen from more than $45 per share to its current level near $9. But on June 20, I saw signs that the stock was bottoming.
The MACD and RSI indicators at the bottom of the chart formed positive divergence. This occurs when a stock makes lower lows, but the indicators make higher lows. This sort of “positive divergence” is often an early warning sign of an impending change in trend – in this case, a year-long downtrend finally reversing to an uptrend.
So, I recommended buying calls last Thursday.
AAOI had spent the past month in a relatively tight trading range between about $8.90 on the downside and $9.70 on the upside. A breakout to the upside of that trading range would spark a decent rally up to the April high, just above $12.50 per share.
We got that breakout. Here’s the updated chart, with a green arrow showing where we sold our first half…

And here’s why it happened…
On Thursday morning, investment bank Rosenblatt Securities upgraded its outlook for AAOI from “Sell” to “Neutral,” and issued a $10 price target on the stock. AAOI ripped higher on the news, pushing our call options up to $2.00 per contract.
As always, we took half of our position off the table… And pocketed 122% on the first leg of the trade.
|
[If you’d like to see Jeff’s full track record – wins and losses – click here.] |
The AAOI trade continues. With this breakout, I still think we have a good chance of tagging our upside target of $12.50.
I’ll let you know how it plays out.
Best regards and good trading,

Jeff Clark
P.S. If you haven’t yet subscribed to Jeff Clark Trader, and you think you’ve missed out on the best gains, I’m happy to say you haven’t.
You see, we have another open trade in the portfolio on Macy’s (M). It’s still within buy range (subscribers can access the trade details here)…
From the closing price on Friday, the trade has 223% upside. It’s just a matter of time before we capture it.
Click here to learn more about a subscription, and all the benefits it provides.