Three weeks ago, I warned readers not to give up on volatility.
While the Volatility Index (VIX) had drifted lower over the past few months, it was still 20% higher on the year. And the chart was forming a bullish falling wedge pattern.
It looked to me like the VIX was on the verge of a sudden spike higher. But now, it looks like we’ll see even more volatility in the coming months.
Here’s an updated look at the VIX’s daily chart…
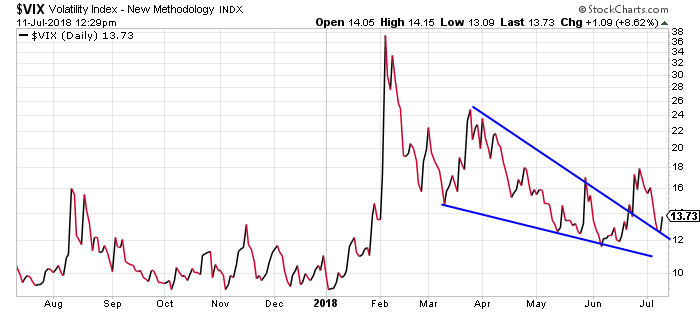
Sure enough, the VIX did break out to the upside of the falling wedge pattern and we did get a sudden spike higher. After running as high as 18, though, the VIX drifted all the way back down below 13 and retested the former resistance line of the wedge as support.
So far, support has held. And, it looks to me like the VIX is set to make a more sustained move higher from here.
You see, for whatever reason, volatility tends to pick up in the summertime. Just look at this five-year chart of the VIX…

In each of the past five years, the VIX has bottomed in early July, then spiked higher just a few weeks later. I expect this seasonal pattern to play out again this year as well.
If so, then the VIX could make it as high as 24 or so in the weeks ahead.
And here’s the important part… a rising VIX is often associated with a falling stock market. That’s not always the case, of course. But, it happens that way more often than not.
Traders should consider being a little cautious right here. If the typical seasonal pattern for the VIX plays out this year, we could be in for a volatile summer.
Best regards and good trading,

Jeff Clark
Reader Mailbag
Have you profited from the volatility that’s struck markets this year?
Tell us your trading stories – and any other questions or suggestions – right here.