
Mike’s note: Mike Merson here, Jeff’s longtime managing editor. With our office closed for the holidays, we’re sharing a series of Jeff’s all-time greatest essays.
Today, Jeff illustrates the power of a specific type of trading analysis… and how it can keep you in the green when volatility rears its ugly head…
Today, I’m going to show you what might be my most profitable trading tool.
If you’re a longtime reader of Market Minute, you’ve seen me use this strategy plenty of times before. If not, you might be a little skeptical at first.
But I can assure you… By using it, you’ll be able to double your money over and over no matter what kind of market we’re in.
I’m talking about technical analysis.
Now, if you’re new to trading, technical analysis might seem a bit “scientific”… even intimidating.
But really, technical analysis is much more of an art than a science… That is, if you try to force it to conform to strict rules and formulas, it’s likely to be wrong almost every time.
Try thinking of it the way I do… A chart of a stock (or index) is simply an emotional picture of the stock at a specific moment in time.
Stock charts tell me how traders/investors are responding emotionally at any given point in time. Human emotions are remarkably consistent. We tend to respond the same way, over and over again, to the same circumstances.
So, if I look at a chart, find a time where the conditions were similar to where they are today, and note how the chart behaved afterwards… it can provide strong clues for what to expect in the future.
But technical analysis is emotional. It evolves over time. So, conditions that used to provide a catalyst for a big move may need to get more extreme to cause a similar movement the next time.
Think about it this way…
When I first got married, I’d often come home from work, take off my socks, and drop them on the floor next to the couch in the living room. My wife would come home, see my socks on the floor, and get all ticked off about it. In other words, she’d have an emotional reaction to her husband leaving his socks in the middle of the living room floor. This happened over and over again.
Now, think of how this reaction would look on a typical stock chart…
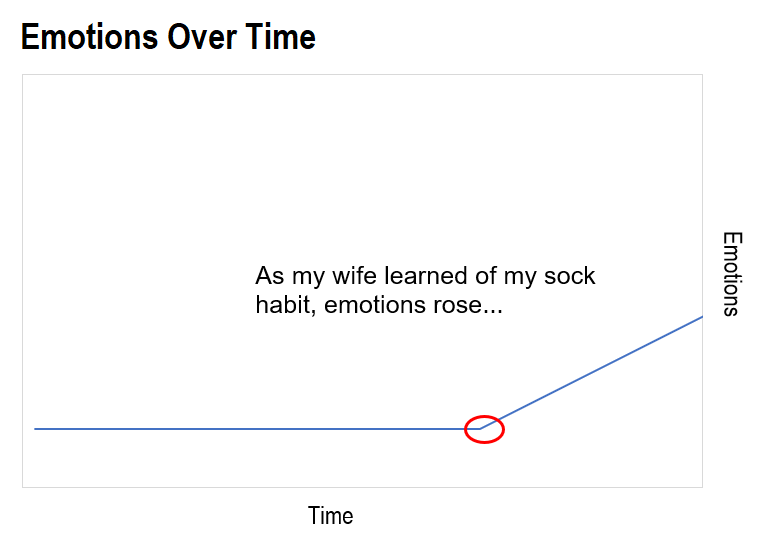
It’d start with a line trending sideways – my wife’s emotions before she knew all about my sock habit. You’d see the line climb as my wife got more and more frustrated…
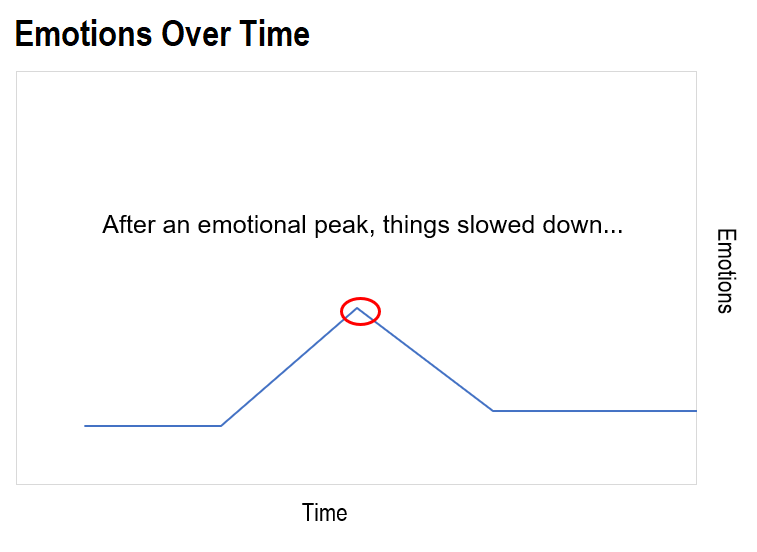
Eventually, though, my wife got a little better about dealing with her slob of a husband, and I got a little better about not leaving my socks next to the couch. Leaving my socks on the floor no longer elicited the same reaction from my wife.
She still had the same emotions. But she had adapted. She had evolved. She suppressed her emotions and would need a bigger catalyst before getting upset with me again…
Over on the chart, things have calmed down. The line on the chart is headed sideways, with little action in either direction. There’s less volatility.
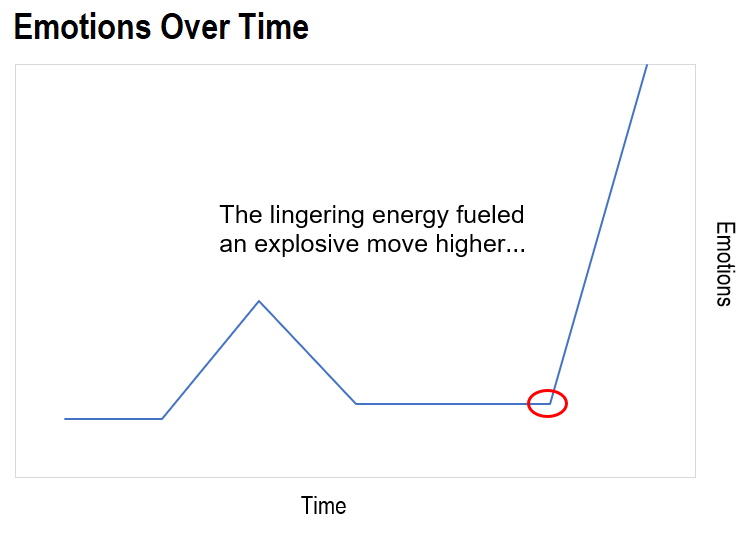
But in the background, energy is building. Those dirty socks had to be going somewhere… and it wasn’t the hamper.
Remember, human emotions don’t change. They’re remarkably consistent. But, emotions do evolve and sometimes it takes a bigger catalyst to elicit the same response.
That catalyst was provided when my wife was vacuuming one day and moved the sofa in order to vacuum the carpet beneath it. She found about a dozen pairs of my dirty socks tucked beneath the couch.
Boom!
You can guess what happened next on the chart…
Here’s my point…
A stock chart is simply the emotional representation of traders’/investors’ reactions to the stock. If we can spot previous patterns on the chart that look similar to how that chart looks today, then we can see how those previous patterns played out and then trade the stock in anticipation of a similar reaction.
A lot of my trading strategy revolves around finding emotionally overbought/oversold conditions that are ready to reverse. Technical analysis helps me identify conditions where investors’ emotions have gotten extreme, and where I can see how stocks have reacted to similar conditions in the past.
This is exactly what traders should be doing, especially in volatile markets.
In volatile markets, any extreme condition is likely to reverse quickly. Likewise, any overly calm condition is likely to explode with energy in due time.
And here’s why: Periods of low volatility are always followed by periods of high volatility – and vice versa.
Consider this… In 2017, stocks just kept marching higher. Overbought conditions just got more overbought. There was nothing for traders to do. No volatility.
At the beginning of 2018, the stock market had just come off the least volatile period of the entire bull market. So, investors who figured stocks would go up forever were greeted with massive drops in February, October, and December.
2019 hasn’t been quite as volatile as that. At writing, the market’s gained around 27% since the start of the year. That’s a remarkable gain – even with some notable drops around May, August, and September.
But as I showed today… That can only last for so long.
I think we’re in for a crazy volatile market next year. Most long-term investors won’t know what to do. They should probably take their gains from 2019 and take a nice vacation.
But this is exactly the environment where traders can thrive… and earn much more than 27%.
Especially those that pay attention to technical analysis. For them, there are opportunities to profit every single trading day… no matter what the market does.
Best regards and good trading,

Jeff Clark
P.S. Technical analysis is just one of the tools I teach – and use to identify winning options trades – in my introductory options advisory Jeff Clark Trader.
You see, trading can be complicated to those just starting out – options trading especially. So, I wanted to create a resource for those looking to add a more active element to their investing… without it being overwhelming.
We trade options on just three stocks in Jeff Clark Trader. That makes it easy to follow along.
And at just $19 a year, there’s no better place to get conservative option trading guidance. Click here for all the details…