Well, this is interesting…
The S&P 500 closed at an all-time high near 2552 last Thursday. Yesterday, the index closed at 2545 – just seven points below the high, or a two-day loss of about 0.27%. Yet, some of our key technical indicators are already oversold.
That’s right… OVERSOLD.
The McClellan Oscillators for the Nasdaq (NAMO) and New York Stock Exchange (NYMO), for example, both closed below their lower Bollinger Bands yesterday. Take a look…
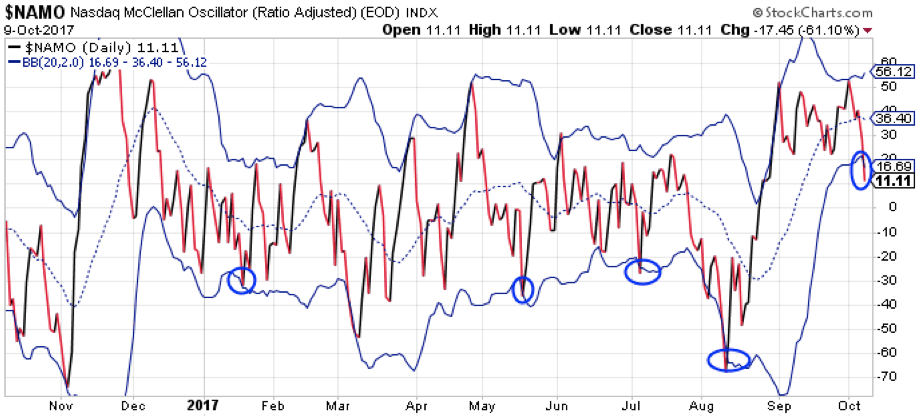
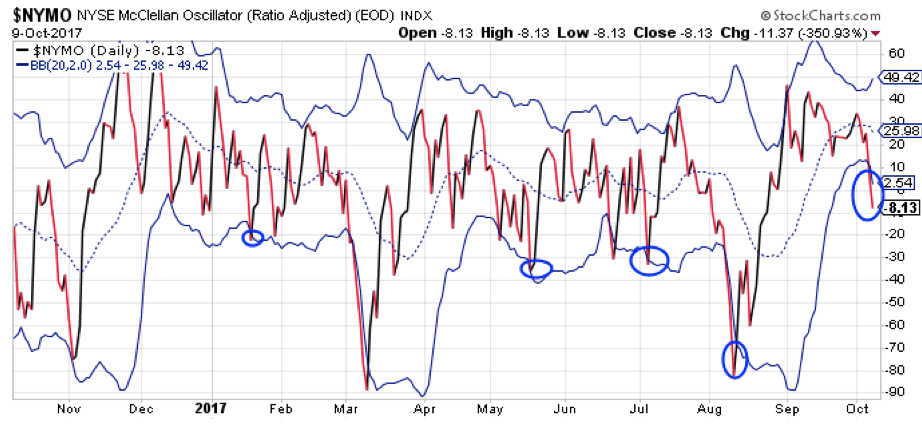
The McClellan Oscillators help to identify overbought and oversold conditions. Bollinger Bands indicate the most probable trading range for a chart. So, when the oscillators trade above their upper Bollinger Bands, we have overbought conditions on the Nasdaq and NYSE indexes. When the oscillators drop below their lower Bollinger Bands, the indexes are oversold.
The blue circles on the charts above show the five times this year when both oscillators dropped into oversold territory at about the same time.
Here’s what happened to the S&P 500 following those occurrences…
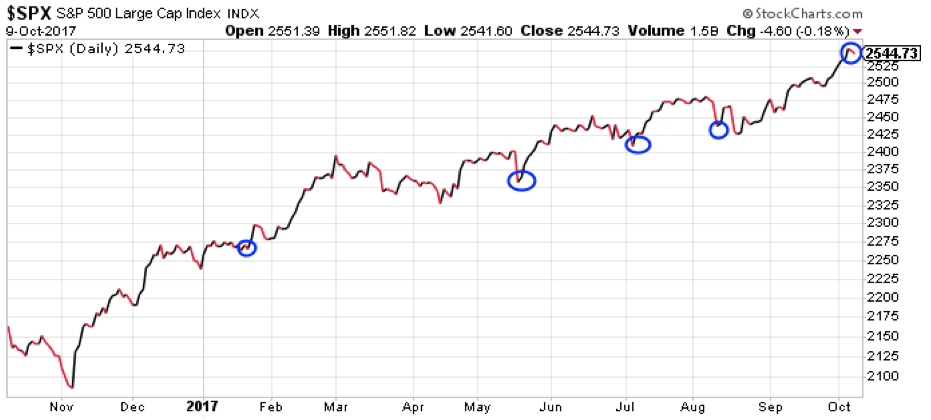
On all four of the previous occasions, the S&P 500 rallied immediately. In three of the four previous times the oscillators were both oversold, it marked the absolute bottom of a short-term decline phase for the market.
Given this history, traders need to be open to the possibility that the small, two-day, 0.27% decline we just saw might be all the decline we’re going to get for a while.
Stocks don’t have to move sharply higher from here. Frankly, I doubt that they will. But it sure doesn’t look like we have the sort of setup that’s going to lead to a sharp correction from here in the short term.
For the past few weeks, I’ve been skeptical of the market’s rally. But I’ve also been reluctant to add any short exposure because we just haven’t seen a low-risk setup for such a position. Given the oversold condition of the McClellan Oscillators, we still don’t have that setup.
Best regards and good trading,

Jeff Clark
P.S. Will you be taking advantage of these conditions in the trading day ahead? Let me know your thoughts, questions, and suggestions right here.
Reader Mailbag
You made a great call on the last gold mining cycle.
I want to hold most of my gold and silver mining stocks for the long run. But based on your input, it is nice to pick up decent income during the short-term cycles. Thanks for your invaluable insights.
– Jim
It’s my first time writing in. I’m on the bullish side of trading this week so far. I’ve been following your letters for a few years as I moved with you over from your previous gig at Stansberry Research.
Thanks for the good trading advice over the years… I’ve kind of developed a feel for the markets over the time I’ve traded alongside you and have used it successfully many times. Maybe I sometimes get out of a trade too soon, but when I feel I should sell, most of the time I do it and am rewarded. The times I don’t, I usually regret it. All this is to say I’m starting to think along your lines.
Again, thanks for doing what you do and sharing it with us. I appreciate it.
– Mike
Recently I signed on for a lifetime subscription to the Delta Report. Thank you for all of your good work.
– Leo
I joined the Delta Report after seeing great short-term setups from following your Market Minute for several months.
I have traded options occasionally, never selling them, and never made money. Watching your training videos finally allowed me to understand the implications involved with selling options. Thank you for clear explanations. Looking forward to enjoying the service.
– John
Hi Jeff, you are truly a master indeed. What about selling uncovered calls on auto loan subprime lenders like CACC and SC? They look like quite in oversold territory.
– Paolo
Appreciate the service and the lessons you teach. Just curious if you have an eye on CVS and Walgreens since they got trounced by Amazon’s announcement to start selling prescription drugs. It looks like an overreaction.
– Patrick
The stock market has been hard to read for a while. I have started using the EUR/USD as a measure for dollar strength. You are looking at GDX as overbought and ready for a bounce up. This is while gold itself is down and the EUR/USD has more weakness down to $1.14-1.15. Then I expect the bounce up to at least $1.20-1.22, a significant move, which should be accompanied by gold strength and stock market weakness.
– Roger
Hi Jeff, I'm trading with a $100k portfolio. How much should I risk per recommendation? I currently risk $2k per trade. Is this too little?
– Harry
Editor’s note: Harry, see this essay for Jeff’s insight on position sizing. According to him, “You should only have 2%-3% of the money you’ve set aside for trading at risk on any one trade.” So, you’re right on the money…
On my way through the historical literature, I was reading the May 23, 2017 Delta Report dealing with SMH and MCD. It referenced in sequence over several pages two SMH charts and one for MCD. However, the first chart was for CCJ, the second chart was for TEVA, and the third chart was for HYG? Are the appropriate SMH and MCD charts available? Thank you.
– David
Well spotted, David. This error has been fixed. Thank you for bringing it to our attention.