Bank stocks did exactly what they needed to do yesterday in order to keep bullish hopes alive.
After a miserable day on Friday, the Financial Select Sector Fund (XLF) blasted higher yesterday. XLF gained 1.8%. It was the best-performing sector in the market yesterday. And, now, XLF is on the verge of breaking out to the upside of its descending triangle pattern. Take a look…
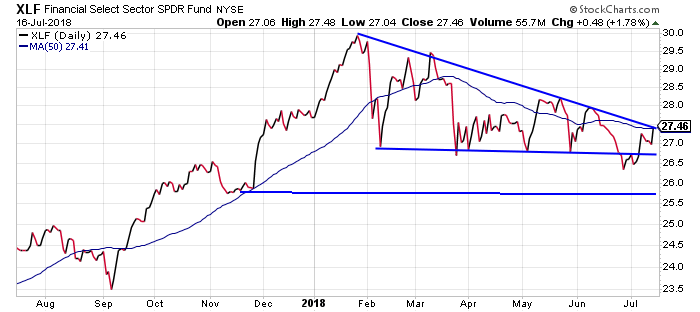
Of course, being “on the verge” of breaking out and actually breaking out are two different things. It’s going to take another strong day in the financial sector to get XLF up and over the downtrending resistance line of the triangle.
For now, though, yesterday’s move is enough to keep the market bulls optimistic.
The problem is… the bears have reason for optimism, too. Take a look at this 60-minute chart of the S&P 500…
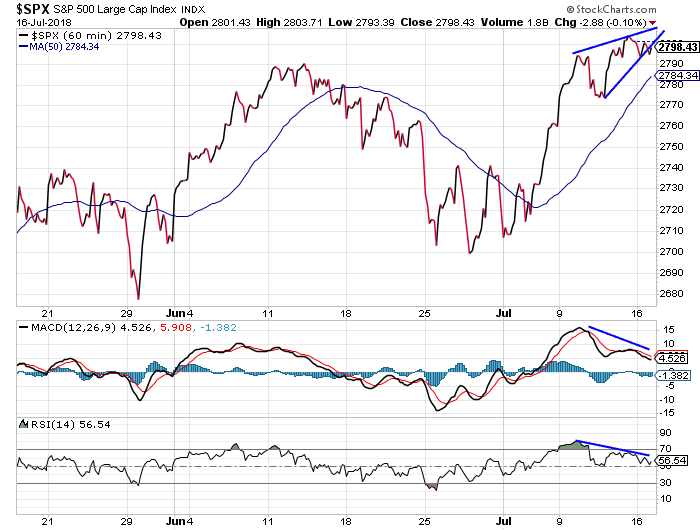
Going into the opening bell yesterday morning, this chart was tracing out a bearish rising wedge pattern with negative divergence on the MACD and RSI indicators. This sort of pattern almost always breaks to the downside.
If you look closely at the chart, you’ll notice the S&P closed yesterday just below the support line of the wedge. If that proves to be a genuine breakdown, then the index is likely headed back towards last week’s low at about 2775.
So, how does a trader decide which way to go when key technical patterns conflict with each other?
One has to look at more information. Look at patterns in the Volatility Index. Look at the levels of key technical indicators like the Put/Call ratio, and the McClellan Oscillator. Try to gather as much information as you can in order to determine which side has the better odds.
Then… trade small.
Big bets in this environment will almost always prove to be a mistake. There’s not enough confidence in one side over the other (bullish or bearish) to justify a large position. Traders end up questioning their positions and doubting themselves on the first adverse move.
They’ll often end up closing their first trade at a loss and then immediately place another trade in the other direction. Inevitably, that trade moves against them as well. And, they end up churning their accounts as the market does its best to frustrate bullish and bearish traders alike.
Personally, given the current setup in the market and all the various indicators, I’m giving a slight edge to the bears for the next big move in the market. But I’ve only placed a small bet on a move to the downside.
Traders should save the bigger bets for times when most indicators are moving in the same direction.
Best regards and good trading,

Jeff Clark
Reader Mailbag
Today, some impressions of Jeff’s daily market analysis…
Many market folks use weekly and daily charts and talk long-term. Jeff shows how he charts and how to think/feel short-term. But short-term becomes long-term. In my opinion, everyone should listen when he talks regression to the mean.
– Roger
Jeff’s comments are right-on. Find his comments to be golden. I am still in the watching stage, but he certainly has my attention!
– Mary
How have you learned – or profited – from the “golden” analysis we send you each morning?
Let us know right here… and don’t hesitate to shoot us a question or suggestion, either.