The Volatility Index (VIX) generated a buy signal on Friday.
Long-time readers know buy signals are triggered when the VIX closes above its upper Bollinger Band (BB) – like it did last Thursday – and then closes back inside the bands like it did on Friday. These signals often lead to large, short-term rallies in the stock market.
And, they can last anywhere from one day to several weeks. So, the obvious question is…
What kind of signal is this?
In order to answer that, let’s look at this chart of the VIX…

The two previous buy signals in early January and late January led to strong, multi-week rallies in the stock market. The S&P 500 gained 4% off the early January buy signal. It rallied more than 5% following the late January signal.
During each of those rallies, the VIX fell below its middle BB (the dashed blue line on the chart), but never quite made it down to its lower BB. If the same sort of pattern plays out this time, then we’ll likely see the VIX fall towards the 20 level or so over the next several sessions.
|
Free Trading Resources Have you checked out Jeff’s free trading resources on his website? It contains a selection of special reports, training videos, and a full trading glossary to help kickstart your trading career – at zero cost to you. Just click here to check it out. |
And, since a falling VIX usually goes along with a rising stock market, Friday’s bounce has more room to run.
Take a look at this updated view of the 2-hour chart of the S&P 500…
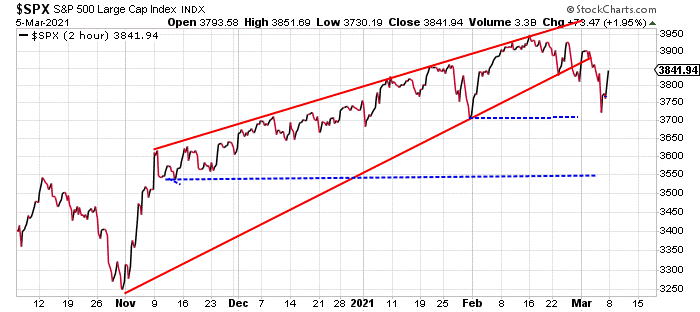
We looked at this chart last Monday, after the index broke below the support line of the rising wedge pattern. We suggested the S&P 500 would bounce back up towards the 3900 level to challenge the resistance of the former support line of the wedge… Then, we could see a more significant decline towards the January low near 3700.
That’s exactly what happened… We got a big bounce on Monday, which tagged the 3900 level. Then, the index dipped towards 3700 by Thursday. Now, the S&P is bouncing back up again.
If the VIX continues lower this week, then the S&P is likely headed back up toward the 3900 level again. But, traders should keep in mind that there’s a bearish pattern in play here. The ultimate downside target for the S&P 500 after breaking the rising wedge pattern is closer to 3550.
This current bounce is less likely to be the start of a new, intermediate-term rally phase for the stock market. It’s more likely to be, simply, a strong bounce off of oversold conditions.
Keep an eye on the VIX this week. The new buy signal probably has a few days to go. But, as the VIX falls below its middle BB, and approaches its lower band, it’ll be time to turn cautious again.
Best regards and good trading,

Jeff Clark
Mike’s note: This Wednesday, our colleague and master hedge fund trader Larry Benedict will reveal how he’s used his edge to profit during an unusual window in the markets that’s coming up…
He calls it the 7-Day Blitz… And in his presentation, Larry will reveal what he’s learned from his 35 years of trading, and how you can be at an advantage during this volatile trading window.
So, join us on Wednesday, March 10 at 8 p.m. ET, where he’ll share his technique and the one ticker you need to potentially make 184% gains like several of his other readers… In just days.
Reader Mailbag
Do you see all signs pointing to a short-term rally in the markets, or are you currently bearish?
Let us know your thoughts – and any questions you have – at [email protected].