
So far in 2019, the stock market has put on a brilliant rally. The S&P 500 is up better than 6% in just a few weeks.
That’s a decent gain for an entire year. It’s a spectacular run for less than a month.
So, as I mentioned last week, investors ought to consider taking some chips off the table and then maybe taking a nap for a little while. I didn’t mention anything about selling stocks short – which is betting on a market decline.
But, we’re nearing the point where betting on the downside is looking like a good trade…
Let me explain…
Take a look at this 60-minute chart of the S&P 500…
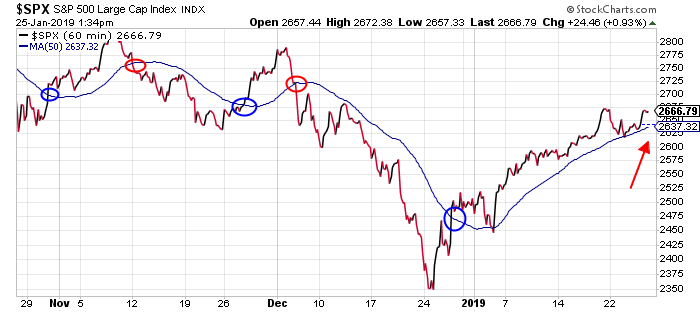
This is a 60-minute chart – which plots data points on the chart at the end of every hour. It’s a short-term look of the stock market. And, patterns on this chart tend to play out within about five to seven trading days.
The interesting thing about this chart is how well it defines short-term, tradable trends in the market. For example, each time the S&P 500 crosses its 50-period moving average (the blue line, which is the 50-hour MA since this is a 60-minute chart), the index tends to make an extended move in the direction of the cross.
Traders would have done quite well over the past three months by simply buying the S&P 500 when it crossed above the 50-period MA on this chart, and then selling that position and going short when the index crossed back below its 50-period MA.
In other words… buy on the blue circles and sell/short on the red circles.
The last signal from this chart was a “buy” signal just before New Year’s Day. The stock market has gone pretty much straight up ever since then.
But, this current uptrend is getting a bit “long in the tooth.” The decline in December lasted about three weeks. The current rally in January is a little over three weeks old as well.
So, I’m thinking it might be time for this chart to cross to the downside. I haven’t yet taken a short position. But, I’m getting anxious to do so.
Because once this chart breaks to the downside… then look out below. We could see the S&P give back a good chunk of its recent gains. A move down to 2510 or so would be a decent target.
So… yes… I’m leaning a bit bearish for the next week or two. But, until this chart actually breaks down, the bulls remain in control.
Keep an eye on that 50-hour MA level near 2637. A close below that level at any point over the next few days should shift the short term trend to bearish.
Best regards and good trading,

Jeff Clark
P.S. Did you catch my brand-new presentation on Saturday? If you did, you know exactly why it’s imperative that you start preparing for 2019 right now.
Taking the right steps means being part of a select group of people… One that came out of 2008 not just unscathed… but even richer than before.
The coming market crash will devastate most folks. But you don’t have to be one of them. Click here to get the full story.