
Buyers were out in force yesterday.
The S&P 500 opened higher in the morning. And despite a brief, small pullback towards the end of the first hour, the index grinded steadily higher the entire day.
The S&P 500 closed at an all-time high. So did the Dow Jones Industrial Average. So did the Russell 2000 and NASDAQ 100 indexes.
There are more new highs on Wall Street than in the entire freshman class at Colorado State University.
Now, though, with the NASDAQ 100 up for nine straight sessions and with the S&P 500 closing above its upper Bollinger Band (an extremely overbought technical condition), we have to wonder how long the market can keep this up.
Let’s go to the charts.
Here’s an updated look at the 15-minute chart of the S&P 500…
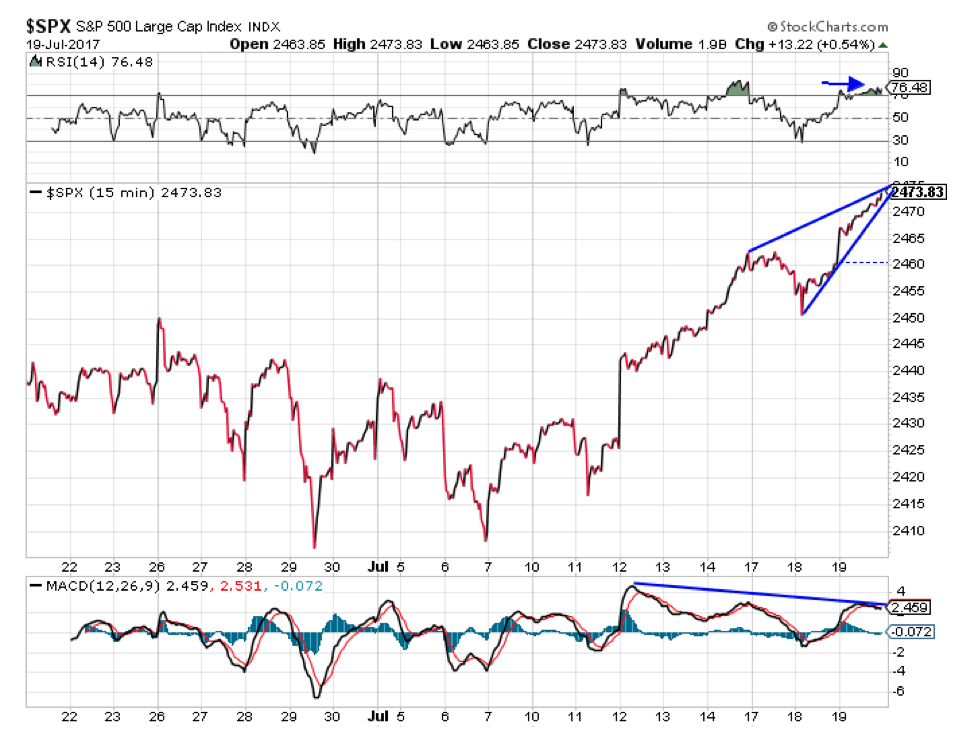
Above, you can recognize a rising wedge pattern with negative divergence on the MACD momentum indicator. This pattern usually breaks to the downside and takes back anywhere from 50% to 100% of the size of the triangle. That would erase all of yesterday’s gains.
Of course, a 15-minute chart is an ultra-short-term time frame. If it plays out, it should happen within the next day or two.
Let’s take a look at the 60-minute chart and see what might develop over the next week…
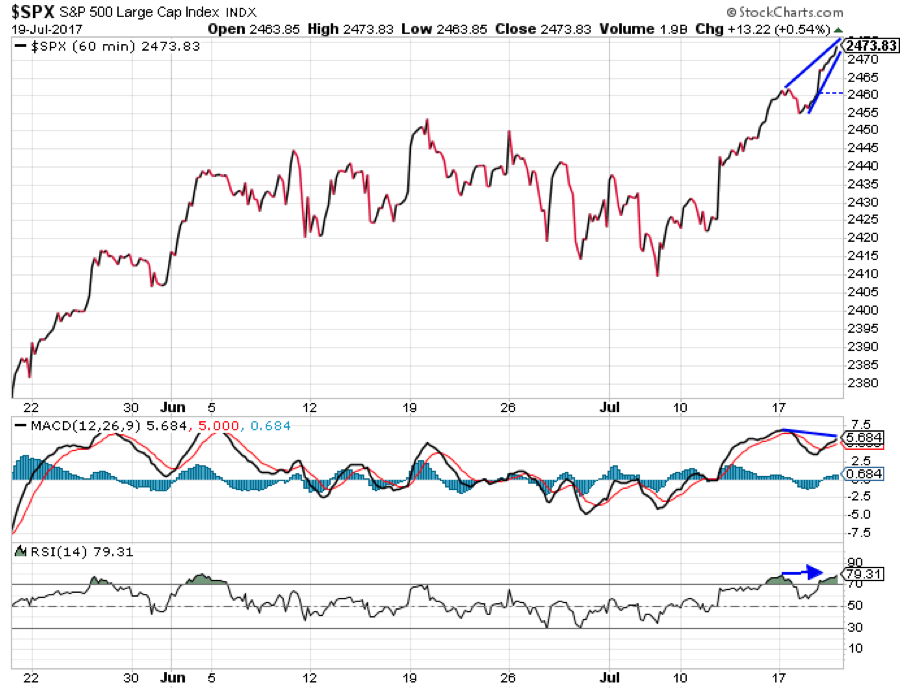
Here we have a similar, though smaller, rising wedge pattern, with negative divergence on the MACD indicator. We also have extremely overbought conditions on the Relative Strength Index (RSI) – which occur when the index climbs above 70.
The last time we had a similar setup was in early June, just before the S&P 500 dropped about 1% in one week.
So, the intraday charts are telling the same story. Stocks are overbought in the short term. They’re vulnerable to a quick pullback. If you’re looking to put new money to work, you’ll likely get a better chance to do so over the next few days.
But we still don’t yet have the sort of conditions that point to a more significant selloff. Many of the daily indicators are approaching overbought conditions, but they’re not there yet. The Volatility Index has not yet closed below its lower Bollinger Band (which usually provides a good, intermediate-term short selling setup). And the high-yield bond sector (HYG) has so far refused to break down.
I suspect we will get a quick decline over the next few days – if only to allow the rising wedge patterns on the intraday charts to play out.
Aggressive traders might consider taking on some small short exposure in anticipation of that. Be willing to take profits quickly, though, if it happens. Like the quick declines we got in May and June, the market might recover from the next decline just as quickly.
Best regards and good trading,

Jeff Clark
P.S. What are your thoughts on the current condition of the market? Are you looking to add some short exposure yourself? Let me know, along with any other questions or concerns, right here.