
Emotion is a trader’s worst enemy.
But it should be your best friend.
The problem, of course, is most traders let their emotions rule their actions. They buy when they’re feeling euphoric. And they sell when they’re scared to death.
Successful traders do the exact opposite.
Of course, we all know the best time to buy stocks is when there’s “blood in the streets.” The best time to sell is when everyone else is rushing in to buy. The trick to getting it right is to know how to recognize your own emotions, then do the opposite of what they’re telling you to do.
It isn’t easy. I’ve been trading stocks and options for almost 30 years, and I still struggle with trading on my emotions – especially when the stock market behaves as it has over the past couple weeks.
But I think I’ve finally figured it out. The answer came to me when I was visiting my friend Dan in the hospital recently.
Dan was in really good spirits, considering he just had quadruple bypass surgery.
“It’s the drugs,” he confessed. “Every time it gets too painful, I just point to the chart over there and the nurse ups my dosage.”
Dan gestured toward a laminated picture of the pain chart.
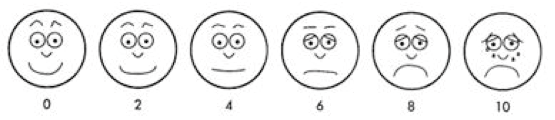
You’ve probably seen it before. It’s a picture of a series of faces that range from happy to sad. Its design helps improve communication between hospital patients and their caregivers.
Here’s what it looks like…
“How are you feeling?” the nurse will ask.
You just point to the face that best represents your pain level, and the nurse drugs you up accordingly. It’s a remarkably simple way to make sure we get the right amount of medicine. If you’re uncomfortable, you just point to one of the frowny faces on the chart and the nurse increases your dosage.
On the other hand, if you’re giddy beyond belief and you point to the super-grin smiley face, the nurse can cut you off completely.
We should use a similar chart for investors.
Think about it… What better way is there to gauge your proper exposure to the stock market?
Once again, we all know the best time to buy stocks is when there’s panic… when investors are suffering the most pain. And we all know the best time to sell is when Mom and Pop are grinning ear to ear because of the huge gains in their stock portfolio.
A financial advisor could instruct any client, “Please point to the face on the chart that best represents how you feel about the stock market right now.” If the client points to a frowny face, the advisor knows it’s a good time to increase that client’s dosage of stocks.
On the other hand, if the client points to one of the happy faces, the advisor knows it’s time to cut back on the dosage.
It is the easiest investment system ever.
Now that the S&P has fallen for six out of nine days, I’d bet most investors out there would count themselves an 8 or 10.
Please drug yourself accordingly… and buy stocks.
Best regards and good trading,

Jeff Clark
P.S. We’re seeing a lot of similarities between how the stock market behaved in late 2007 and how it’s acting today. That raises some concerns about what might be in store for 2019. But, I’m more excited than concerned.
2008 was one of my best trading years – ever. So, I’m looking forward to increased volatility and continued wild swings in the stock market.
And, for the first time ever, we’re introducing a new way of showing you how to profit off of the moves.
I’ll provide all the details in an upcoming live presentation on Thursday, December 6. Make sure you sign up for it right here…
Reader Mailbag
How would you rank your portfolio on the scale above? What changes are you looking to make before the end of the year?
As always, send in your trading questions, suggestions, or stories to [email protected].