
Two weeks ago I asked, “Is the dollar ready to bounce?”.
The market was quick to answer, “NO!”
The US Dollar Index kept falling. It made a new low for the year last Friday.
But here’s the thing… All of the technical conditions that were in place and supporting a bounce two weeks ago look even stronger today.
Now, since the dollar has popped a bit higher this week and is trading almost back to where it was two weeks ago, and since I’ve had a couple days to wipe the egg off my face, I’m ready to ask again…
“Is the buck poised for a bounce?”
Here’s another look at the daily chart of the U.S. dollar…
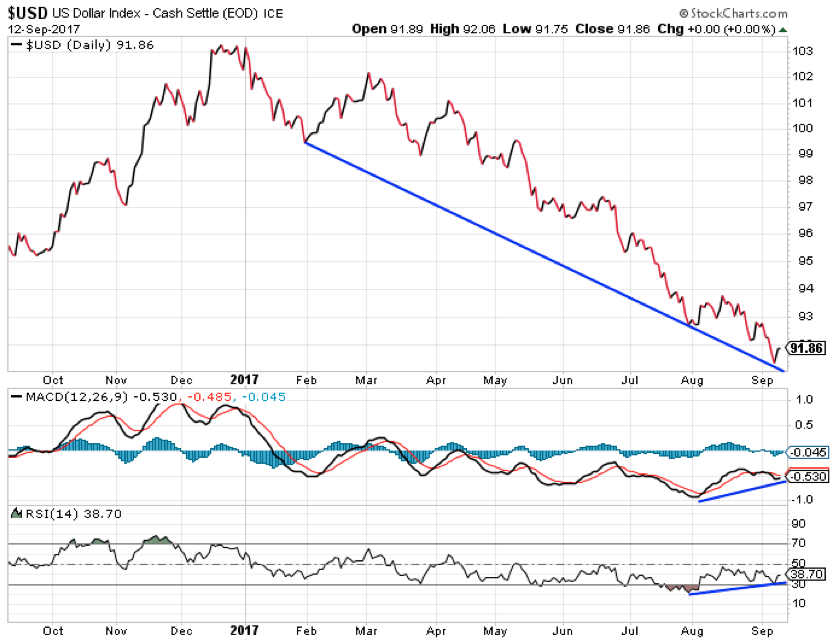
The dollar has been trending lower all year. But, while the buck has been making new lows over the past month, key momentum indicators like the MACD and RSI have made higher lows. This “positive divergence” signals the momentum behind the current trend is weakening. It’s often an early sign of a pending reversal.
But it’s not a guarantee of an immediate reversal. When this sort of divergence shows up on a daily chart, traders should then shift to a shorter timeframe and look at the intraday charts to refine their timing of a trade.
I didn’t do that – which is why I was early in calling for a bounce in the dollar.
Part of the problem is that the charting service I use does not provide intraday updates on the US Dollar Index chart. So, what I should have done instead is look at the intraday charts of the PowerShares DB US Dollar Index Bullish Fund (UUP) – an exchange-traded fund designed to track the action in the US Dollar Index.
Here’s a look at its 15-minute chart…
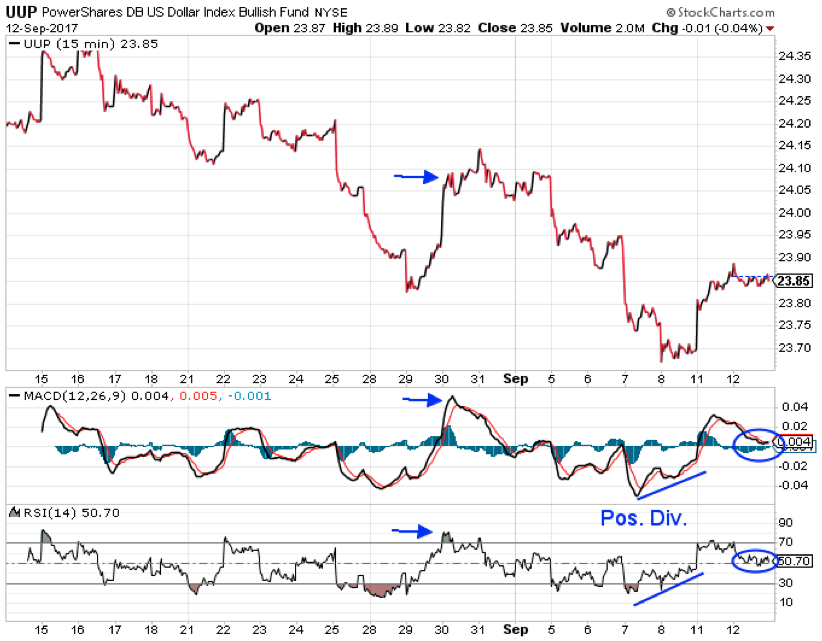
The blue arrows point to where UUP was trading when I first wrote about the dollar two weeks ago. While the daily chart of the buck looked ready to support a bounce, the short-term, 15-minute chart of UUP showed extremely overbought conditions. Both the MACD and RSI indicators were near their highest levels of the month.
In other words, the daily chart and the intraday charts were in conflict. The daily chart, where patterns tend to play out over a month or two, was bullish. But the 15-minute chart, where patterns tend to play out over one or two days, was overbought and warning of a quick pullback.
That pullback played out last week.
Now, though, the intraday chart looks bullish and supports the potential for a rally in the buck.
After dropping to a new low on Thursday, UUP spent all of Friday chopping back and forth in a tight trading range. But, during that choppy action, both the MACD and RSI indicators worked higher and developed positive divergence. That led to a strong bounce in UUP on Monday.
On that bounce, the MACD and RSI indicators once again shot back up to overbought levels.
But – and this is important – notice what happened in the action yesterday. UUP chopped back and forth in a tight trading range. That gave the MACD and RSI indicators enough time to back off from overbought conditions and return to neutral. So now there’s enough energy to fuel another short-term push higher on the intraday chart of UUP.
And that short-term push higher should help create a more bullish-looking pattern on the daily chart of the US Dollar Index.
The last time I asked, “Is the dollar ready to rally?” the market said, “no.”
This time, I expect we’ll get a different answer.
Best regards and good trading,

Jeff Clark
P.S. What are your thoughts on the bullish setup in the dollar right now? Send me your responses, questions, and suggestions right here.