
We finally got some action yesterday in the S&P 500.
Stocks moved lower at first. But then buyers stepped up and pushed the index to a new all-time high of 2491. It looked like we were off to the races again.
But traders barely had time to put on their “S&P 2500” t-shirts before sellers took over.
The S&P sold off all the way down to 2470 – a 21-point drop from the highs, and the largest intraday move we’ve seen in over a month. It was enough to get a few of my diehard bearish friends to send me emails asking “Is this it? Is the market ready to crack this time?”
I didn’t even have to respond.
Within moments of getting the email, buyers started to come back into the market. The S&P closed at 2474.92 – right smack dab in the middle of its three-week-long trading range, and just a fraction above its 9-day exponential moving average (EMA) line.
Regular readers know the 9-day EMA is a short-term support or resistance level for most major stock market averages. If the index is trading above the 9-day EMA, then momentum is bullish. If the index is below the line, the bears have the momentum.
Regular readers also know that while I’ve been cautious on the stock market for the past couple of months, I’ve also argued that we can’t get too bearish – and we certainly shouldn’t pile into aggressive short positions – until the S&P 500 closes below its 9-day EMA.
That did not happen yesterday. Take a look…
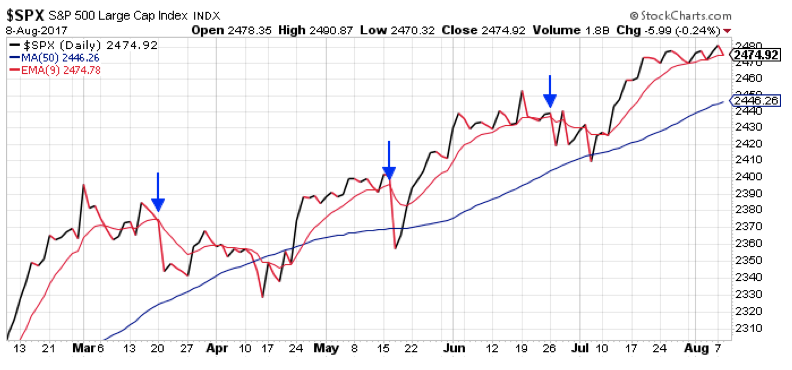
The blue arrows on the chart point to the three times this year the S&P has closed below its 9-day EMA (the red line). From there, it’s usually a straight shot lower to support at the 50-day moving average (the blue line).
Like I said, yesterday the S&P closed just above the 9-day EMA. Stock futures are selling off overnight, so maybe today will be “The Day.” If the S&P does close below the 2373 level, then the next support is down at around 2447.
That would be enough to cause some pain to the bulls, and to give the bears a reason to cheer – for a change.
But don’t yet count on a selloff larger than that. Several technical indicators are already in oversold territory just after yesterday’s decline. If we do get down to the 2447 area, those indicators are likely to be extremely oversold and on the verge of generating a buy signal. So, at least in the short-term, the biggest decline the bears should count on is a drop towards the 50-day MA.
I’ll cover some of those oversold technical indicators in a future Market Minute.
Best regards and good trading,

Jeff Clark
P.S. I’ve been bearish on this market for quite a while… but what about you? Are these cracks in the market the start of something bigger? Send me your thoughts – along with any other questions, suggestions, or ideas – right here.