
Mike’s note: Before we get started on this Monday’s Market Minute, I wanted to quickly remind you about Jeff’s special presentation last week, where he taught his 18-year-old son Carson how to use the same trading techniques Jeff’s been using for over 30 years.
To see if Carson was able to double his money using options… and claim Jeff’s free option trade recommendation… just click here. But don’t wait. It won’t be available for much longer…
One of my favorite indicators has been misfiring a lot lately.
The Chicago Board Options Exchange (CBOE) put/call ratio (CPC) is one of the most reliable technical indicators for generating buy and sell signals.
Most times, when the CPC pops above 1.20 – indicating traders are buying far more put options than call options – the stock market hits at least a short-term bottom. And, most times when the CPC dips below 0.80 – meaning folks are buying far more calls than puts – the market hits a short-term high.
The stock market rarely rewards the popular opinion. So, whenever the CPC reaches extreme levels, it’s often profitable to bet on a reversal in the other direction. Indeed, using the CPC as a contrary indicator has paid off quite well over the past two years.
Over the past month, though… not so much. The CPC spent the entire month of August below 0.80.
Take a look…
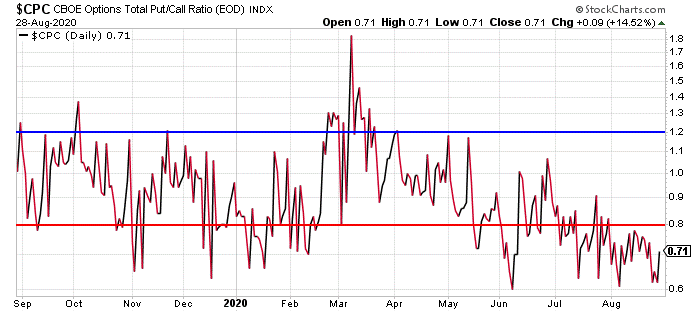
This sort of condition should have created at least a short-term pullback in the stock market. But, it hasn’t happened. The market just keeps powering higher.
As I said, it’s rare for the market to reward the popular opinion. But, that’s what’s happening.
Buying call options is paying off.
This same sort of thing happened back in January 2018. Folks may recall that as another period when stock prices just kept pressing higher day after day.
The market was melting up. And, traders were buying call options into that action.
Here’s how the CPC looked back then…
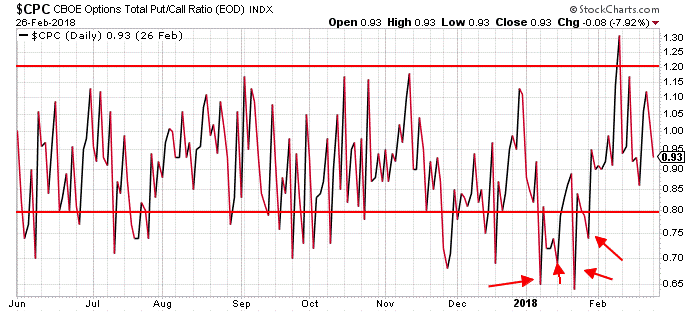
The cluster of arrows in January 2018 looks remarkably similar to the sort of action we’re seeing on the chart today. So, it might be useful to take a look at how the S&P 500 performed in February 2018 to get some clues as to what might happen in the weeks ahead.
Look at this Friday’s chart of the S&P 500…
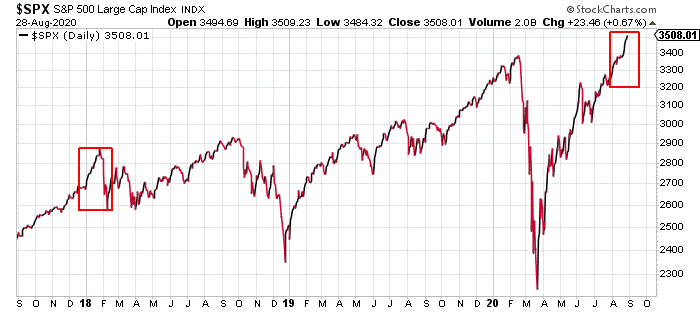
The relentless move higher in January 2018 was followed by an even more powerful decline. The S&P 500 lost about 12% in less than two weeks. So, while the individual “sell signals” from the put/call ratio didn’t pay off immediately, the cluster of sell signals warned of an impending strong decline.
The stock market action today sure looks similar to the action back in January 2018. And, the cluster of sell signals from the CPC looks similar as well.
None of the recent sell signals have paid off yet. That has lots of folks wondering if the CPC is no longer a useful indicator.
Of course, many folks thought that back in January 2018 as well. It’s not different this time.
Traders shouldn’t be too quick to dismiss the CPC. It may be a warning of something more dramatic than a simple, short-term decline.
Best regards and good trading,

Jeff Clark
P.S. Last week, I held a live presentation with my 18-year-old son Carson to see if he could double his money using the same trading techniques I’ve been using for decades.
During the presentation, he asked me all about how I use charts and indicators to track the market to make the best trade recommendations for my readers.
If you’d like to see my answers, and claim a free trade recommendation, just click here.
Reader Mailbag
Do you think that the CPC indicator is still worth following, or do you think the market will move in an unexpected way?
Write in your thoughts – and any questions you may have – to [email protected].