
Check out this chart of the ETFMG Alternative Harvest ETF (MJ) – an exchange-traded fund holding multiple securities in the cannabis sector…
This is perhaps one of the ugliest-looking charts in the market today. MJ is trading lower than it was last Christmas Eve, when the rest of the broad stock market hit bottom. And, the pot sector is down nearly 50% from where it peaked in late March.
In other words, while the S&P 500 has rallied nearly 31% since bottoming last Christmas Eve, the pot sector has fallen another 20%.
In fact, MJ now trades for about the same price it traded for back in early 2016, before recreational pot was legalized in Canada, California, Nevada, Michigan, and a handful of other states.
And this is what offers a potentially exceptional opportunity…
You see, the pot sector today is in far better shape than it was back in early 2016. Pot smoking is legal in many more states now than it was back then. Several more states are likely
to legalize marijuana for medical and recreational purposes in 2020. And, there’s little doubt the U.S. government will legalize marijuana in the near future.
So the demand for marijuana is going to increase – perhaps exponentially – in the near future. Meanwhile, the price of marijuana stocks has collapsed.
That’s our opportunity.
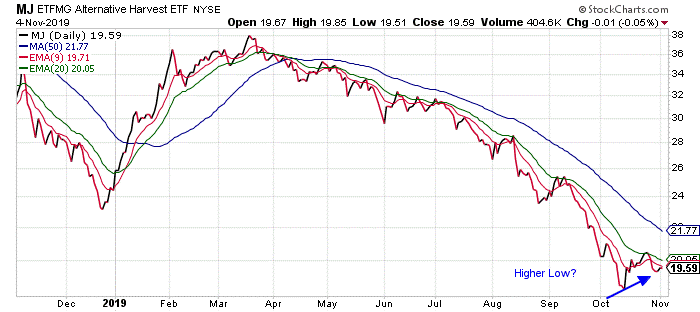
Let’s take another look at the previous chart.
Ever since MJ peaked in March and entered a sustained downtrend, the chart never showed a definitive higher low. Every bounce off each short-term low failed to make a higher high.
So, the trend was obviously lower. And, there was no reason to try to “bottom fish” in the sector.
In other words… there was nothing on the chart that suggested a potential bottom was in place.
Until now…
After a seven-month decline, MJ is now starting to show signs of bottoming. The stock traded down to $19 per share in early October. It bounced back up to test its 20-day exponential moving average (the green line on the chart) as resistance. And, it pulled back – just as it has every time it tested the 20-day EMA since late March.
But this time, it looks like MJ has formed a higher low on the chart. This is the first step in establishing a new uptrend.
There aren’t any guarantees, of course. But, if MJ can hold above the early-October low and then break above the 20-day EMA, then the odds favor the start of a new intermediate-term uptrend for the pot stocks.
And, given the horrendous performance of the sector over the past nine months, the “catch up” rally could be quite substantial.
Best regards and good trading,

Jeff Clark
Reader Mailbag
Do you plan to buy pot stocks ahead of a potentially bullish move? Or do you think there’s more downside ahead?
Send in your responses – along with any other comments and questions – to [email protected].