
Here’s what to look for in the action today…
General Trends
Today, President Trump will reveal his tax-reform plan – or at least an outline of what he’d like to see done. A few of the possible proposals have already been leaked – like reducing the corporate tax rate to 15%, and taxing repatriation of foreign earnings at 10%. These are stock-market-friendly ideas. And the leaking of them is at least partly responsible for terrific rally we’ve seen so far this week.
Whatever news comes out later today has probably already been discounted by the market. So stocks are vulnerable to a “sell on the news” reaction.
Here in the Market Minute, I show you how the major markets are setting up for the day… and share my thoughts for boosting your returns. It’s how I’m planning to trade my own money.
Now that we covered general trends, let’s see what’s happening with the S&P…
Stocks
On Monday, the S&P 500 blew right through resistance at 2354. Yesterday, it powered through the 2376 resistance level. Today, we’ll get to see how the index deals with 2385-ish.
For the short term, the market is quite extended to the upside. The S&P shrugged off the negative divergence on the 15-minute chart I showed you yesterday, and it rallied right up to my first target for this rally – 2385.
And, we have to deal with another bout of negative divergence today. Look at this 15-minute chart of the S&P 500…
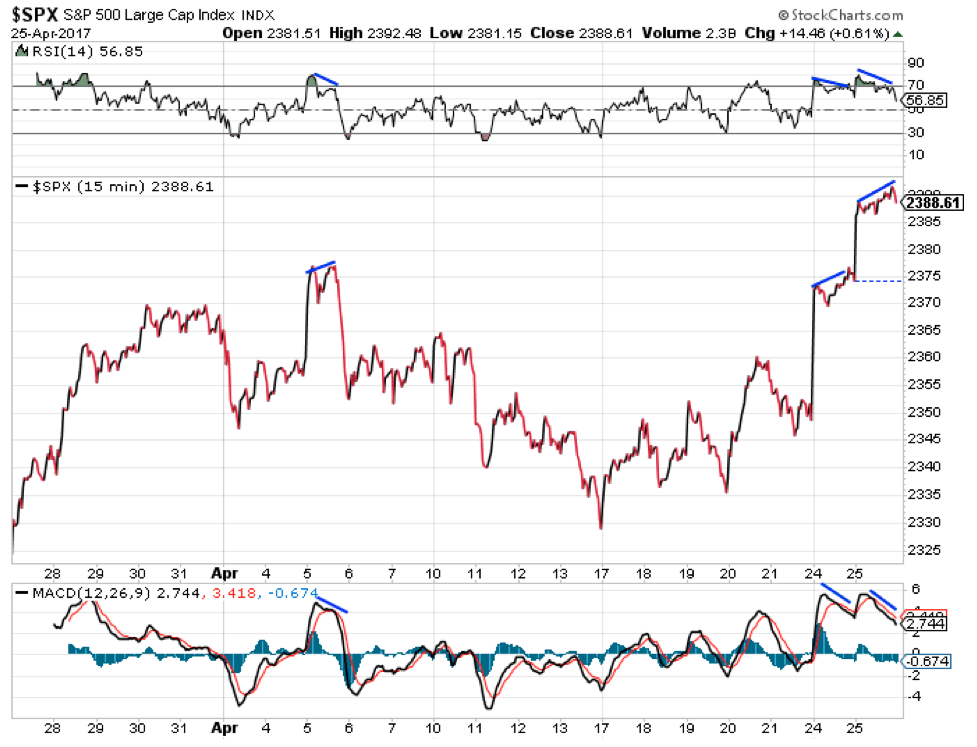
The action yesterday was identical to what we saw on Monday. Stocks gapped higher and then spent the rest of the day slowly adding to the gains. Meanwhile, technical indicators like the MACD (Moving Average Convergence Divergence) momentum indicator and the RSI (Relative Strength Index) declined steadily and formed negative divergence.
It’s rare to see two identical days back-to-back. I don’t ever recall seeing a string of three identical days. So, even though the negative divergence did not play out as I expected to yesterday, there’s a good chance we’ll see a decent pullback today.
Gold and Gold Stocks
We were looking for more weakness in the gold sector, and we got it. Gold stocks got crushed yesterday. The Gold Bugs Index (HUI) fell almost 5%.
The sector is now oversold enough that we can start looking for a bottom.
Typically, the gold sector bottoms by falling sharply on the opening and then reversing and closing higher on the day. That type of action usually marks a selling climax for the sector. That’s the sort of action I’ll be looking for in order to add exposure to the gold stocks.
I’m tempted to nibble a little bit here. Some of the intraday charts for many gold stocks are oversold with positive divergence. They might be due for a least a short term bounce.
Aggressive traders without much exposure to gold stocks might consider buying some here for a quick trade.
Conservative traders should probably wait until we get the sort of bottoming action I just described.
I’ll update regular readers on these trends throughout the day on Jeff Clark Direct.
Best regards and good trading,

Jeff Clark
P.S. Ever since I made my first option trade three decades ago, I’ve been hooked on the strategy. If you use options the right way, it can dramatically reduce your risk and boost your portfolio returns. If you’ve never used this powerful strategy, my Guide to Option Trading will teach you everything you need to know. You’ll find it right here.