
It’s going to be a long, boring summer if the S&P doesn’t move more than seven points. For three straight days, the index has been stuck in the same seven-point trading range.
It’s remarkable to think that a market with millions of participants and trillions of dollars at work can be motionless for more than a few hours – let alone a few days.
The one thing that traders should remember during this time is that periods of low volatility are ALWAYS followed by periods of high volatility, and vice versa.
Don’t let your guard down.
With that in mind, here’s what to look for in the action today…
Stocks
For today, let’s take a look at the 15-minute chart of the S&P 500. The 15-minute chart is a short-term chart that displays the market action in 15-minute intervals, as opposed to the standard daily chart, which shows one-day intervals.
When there’s not much action to look at on the daily chart, sometimes it’s useful to look at a shorter-term time frame to get an idea of what’s going on.
Here’s the 15-minute chart of the S&P 500…
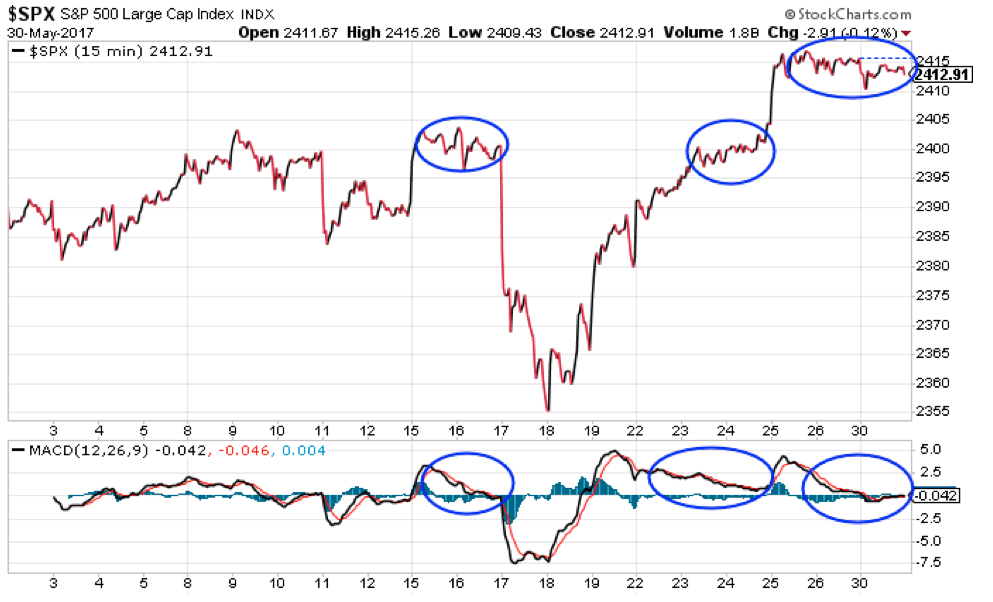
The blue circles on the chart show the three periods this month the S&P 500 was stuck in a tight trading range for a few days. This choppy, consolidating, back-and-forth action is one way the market builds up energy for its next move.
Notice how during each of these periods, the MACD momentum indicator reached overbought levels and then gradually cycled back to neutral. That’s like the stock market recharging its battery. Once the MACD cycles back to neutral, the market is ready to make another move.
On May 17, the move was to the downside. On May 25, the move was higher.
Now the MACD has cycled back to neutral again. The market is ready to make its next move.
We could go either way here. But, my guess… and it’s only a guess… is the next move will be to the downside.
On Friday, I wrote about how Volatility Index (VIX) option prices were skewed in favor of a higher VIX over the next three weeks. That’s the same sort of condition we had going into the big drop on May 17. So, with that backdrop, I’m going to give the bears a slight edge over the next few days.
However, price action remains bullish. The S&P is still trading above its 9-day exponential moving average (EMA) at 2402. High-yield bonds and the semiconductor sector – the two assets I told you to watch yesterday – are holding up.
That’s why the bears only get a slight edge. And traders should only hold small exposure to the short side.
I’ll update Delta Report readers on these trends throughout the day on Jeff Clark Direct.
Best regards and good trading,

Jeff Clark
Mailbag
Thanks to all my readers for your feedback. Don’t hesitate to keep it coming right here.
Here are a few that came in recently…
I have been an investor for 50 years and have used many paid for newsletters and services during this time. I have been your subscriber since February. I have found your information to be exceptional with your insight, analysis, and use of MACD, RSI, and Bollinger Bands on charts. The last several weeks your information of the markets reaching a possible top has been clear. With this information and charts of VIX, I purchased VIX June 11,11.5 calls on May 9th with VIX in the 10 range. I closed these on the morning of May 18 with about a 50% gain. What better information could a subscriber ask for or expect to make a trade? THANK YOU Mr Clark for the outstanding information, charts, and analysis you provide.
– Jack
I have followed you for about three years. Been saving and finally had the money to join your site. Looking so forward to using your advice in options! Thank you for allowing the little people to be a part! I have all of my accounts approved and money in the bank. Waiting on your advice.
– Russell
Thanks Jeff. Would love to see the new report. I had a great trade with AG. Made 40%+. Keep up the good work!
– Dale