
So far, the stock market is playing out the typical pre-FOMC (Federal Open Market Committee) announcement pattern – where stocks trade lower on the Friday and Monday before the announcement, and then trade higher on Tuesday and Wednesday morning when the meeting is on. So, if this pattern holds, then we should see some modest strength in stocks today and early tomorrow.
After the announcement on Wednesday afternoon, though, anything goes.
Stocks
The stock market does seem to be changing character. The high-valuation, high-growth, high-risk momentum trades that everyone seemed to chase higher over the past several weeks have fallen hard over the past two sessions. Stocks like Google/Alphabet (GOOGL), Amazon (AMZN), and Netflix (NFLX) are down 4%, 5%, and 8% respectively.
Meanwhile, energy and retail stocks – which most traders had given up for dead – have posted nice gains since Thursday. For example, the Energy Select Sector SPDR ETF (XLE) and the SPDR S&P Retail ETF (XRT) are both up about 3%.
One of the worst-performing blue-chip stocks of the year, Target Corp. (TGT) – which up until last Thursday had underperformed the S&P by 30% in 2017 – posted a nice 6% gain in the past two days (which helped my Delta Report subscribers record a 136% gain on the TGT call options we bought last Thursday).
This rotation – out of the “risky” sectors and into the beaten-down “value” sectors – is helping the broad-based S&P 500 to hold on to its bullish price momentum.
Despite the carnage in the tech-stock-heavy NASDAQ, the S&P 500 is still trading above its 9-day exponential moving average (EMA) line. Take a look…
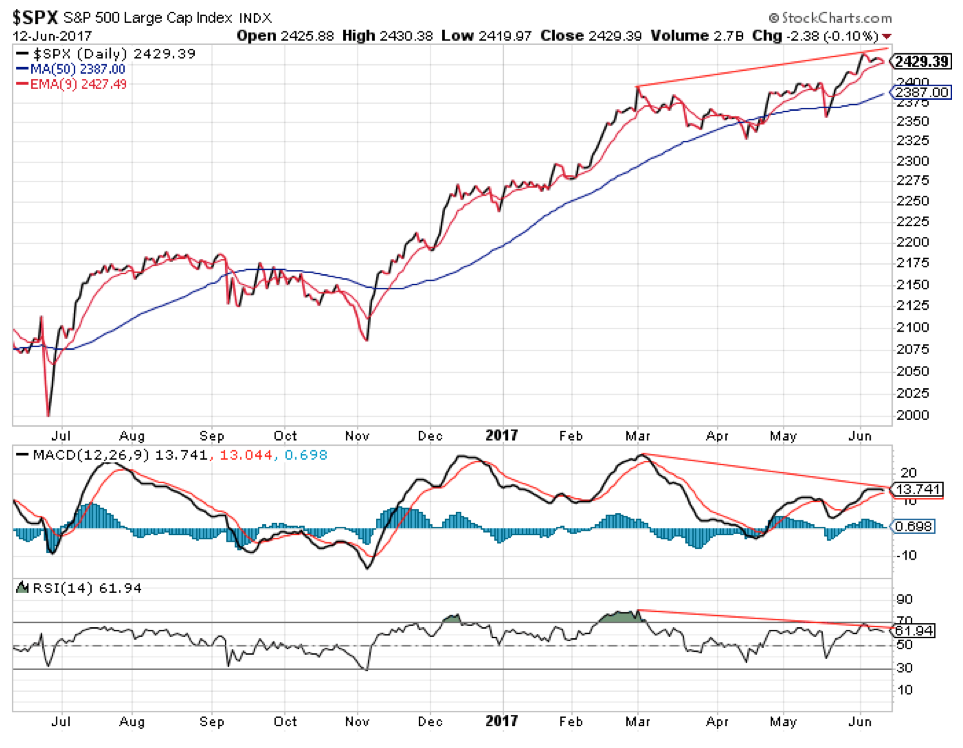
The S&P 500 closed at 2429 yesterday – two points above the support of its 9-day EMA (the thin red line). As long as the index holds above that level on a closing basis, the bulls still have the momentum and we can’t rule out the possibility of another push to all-time highs (above 2440).
But, you can see the negative divergence on technical indicators like the MACD momentum indicator, which shows the relationship between 26- and 12-day EMA, and the Relative Strength Index (RSI), which measures the speed and change of price movements.
At some point, that divergence is going to play out and the S&P is going to suffer a correction. I expect that will happen sometime this summer.
For today, though, the odds favor higher stock prices. At least to keep the pre-FOMC pattern intact.
I’ll update Delta Report readers on these trends throughout the day on Jeff Clark Direct.
Best regards and good trading,

Jeff Clark
P.S. If you haven't heard, I released my new “profit windows” trading system to my Delta Report subscribers last week.
It's the product of over five years of research, and it shows. Over a yearlong test, my system produced a 90.2% success rate, 50% average gains, and an average trade length of just two days.
You can learn more about how to profit from my new system right here. But this offer is closing at midnight tonight, so be sure to watch this video before then.
Mailbag
Thanks again to everyone for all your thoughtful feedback. Remember, if you have any questions, concerns, or great trading stories to share, be sure to send them right here.
Great job on the TGT calls, that's what I'm taking about! Thanks!!!
– Ryan
I am intrigued by your service and am ready to engage in it with a small portion of my investment resources. I have traded options for many years but never had the kind of straight-talk advice that you offer. So, I am one of your newest subscribers to Delta Report and your blog (great idea for more reasons than one).
I am a bit familiar with you through your (past?) association with Stansberry Research. Glad to see you in your own service, too. Looking forward to Delta Report and your Blog working for me during these uncertain times!
– Goetz
I for one, I have to tell you, find your technical discussions of pattern evaluation quite entertaining. For me they also add credence to your recommendations. Surely appreciating the transparency. So please don't be shy!
– Kristian