
No matter how far a rubber band stretches, it can always stretch farther. Extreme conditions can always get more extreme.
For example, we entered last week looking for a bounce in the stock market…
Conditions were stretched to the downside… investor sentiment (a contrary indicator) was more bearish than at any time since the COVID meltdown two years ago… the CBOE put/call
ratio was at its highest level in a year – meaning folks were jumping over each other to buy put options.
And, since the stock market rarely rewards the popular trade, we figured the market was setting up for a rally.
We were right, then wrong, then right again, and then wrong again…
In other words, the market was all over the place last week – doing its best to frustrate both bullish and bearish participants.
By the time the closing bell rang on Friday, the S&P 500 was 140 points below where it had started the week.
Various technical indicators had fallen to more oversold levels, and the proverbial rubber band had stretched even farther to the downside.
Take a look at this updated chart of the CBOE put/call ratio…
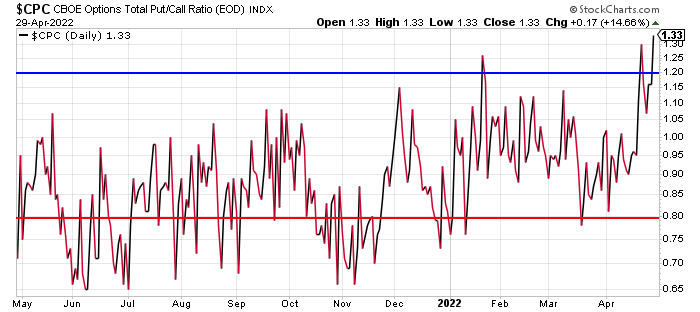
This ratio is higher today than it was when we looked at it last week.
That’s also true of the Volatility Index (VIX), which closed above its upper Bollinger Band again on Friday. Take a look…

The VIX will generate a new, broad stock market buy signal when it closes back inside its Bollinger Bands. That could happen as soon as today (blue arrow).
The S&P gained over 400 points in three weeks following the last buy signal in early March.
|
Free Trading Resources Have you checked out Jeff’s free trading resources on his website? It contains a selection of special reports, training videos, and a full trading glossary to help kickstart your trading career – at zero cost to you. Just click here to check it out. |
And the American Association of Individual Investors (AAII) reported the percentage of survey respondents looking for a rally in stocks over the next six months had fallen to 16%. The number of bearish respondents reached 59%.
That’s the biggest and most bearish spread in the AAII survey since March 2009 (at the depths of the Global Financial Crisis).
In other words, as stretched to the downside as the stock market’s rubber band was last week, it’s even more stretched today. That’s a reminder that oversold conditions can always get more oversold.
But, in the entire history of the stock market, the rubber band has never broken. Instead, it has always snapped back.
Last week’s overstretched conditions didn’t lead to a sustainable rally, but they did lead to a snap-back bounce last Thursday.
Today, conditions are even more overstretched. So, I’ll repeat what I wrote last Monday…
It seems like the market is near the end of this decline phase. Traders should be buying into any weakness early this week.
Best regards and good trading,

Jeff Clark
Reader Mailbag
How have you profited from the recent volatility in the markets using options?
Let us know your thoughts – and any questions you have – at [email protected].