
Financial stocks had a horrible June.
The Financial Select Sector ETF (XLF) lost nearly 2%. It closed lower 13 days in a row – something that has never happened before.
And on Friday, following good news from the Fed stress tests, XLF opened sharply higher… But then gave back everything by the end of the day.
This is poor, poor action. And at first glance, it doesn’t look like the action is going to get any better. Take a look at this chart of XLF…
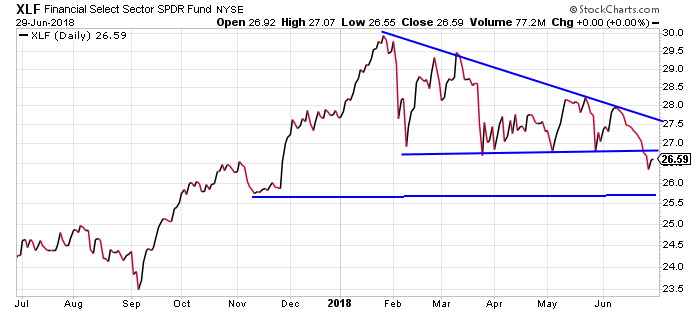
XLF has broken down from a descending triangle pattern. It looks headed for a test of the next support level at about $25.70. And since the financial sector tends to lead the broad stock market, a further decline in XLF is going to make it hard for the market to rally.
But, there is another way to look at things…
Here’s the same chart of XLF. This time, though, it’s plotted along with its Bollinger Bands…
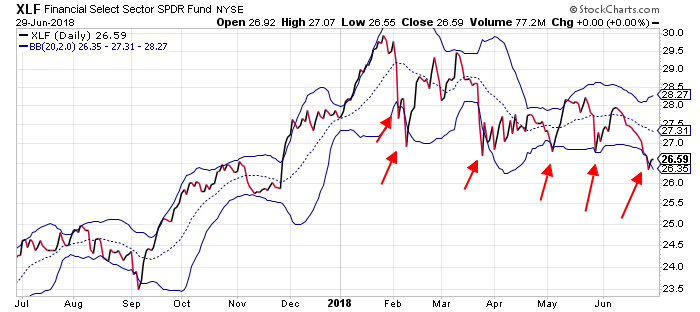
XLF closed below its lower Bollinger Band last Thursday. That’s the sixth time that’s happened so far in 2018. Four of the previous times this happened, XLF snapped back higher right away.
The other time – in late January – XLF popped higher for a couple of days. Then it rolled over and dropped again below its lower Bollinger Band. From there, XLF put on a sharp rally that lasted several weeks.
So, it looks like buying XLF whenever it dips below its lower Bollinger Band has been a fairly profitable strategy.
The only question is whether last Thursday’s dip is going to turn out like the previous four dips (where XLF popped higher right away) or if it’s going to resemble the dip from late July (where XLF sold off to a lower low before launching a strong rally).
Either way, it seems to me the odds favor the financial sector working higher over the next few weeks. That should help the broad stock market work higher as well.
Best regards and good trading,

Jeff Clark
Reader Mailbag
Are you making a bet on financials heading into the week?
Tell us about it – along with any other comments, questions, or suggestions – right here.