
I bailed on my short trades yesterday. And I told my Delta Report subscribers to take profits on the short position we entered last Wednesday.
It was just a small profit… but it was a profit. And I wanted to make sure we held onto it.
No, I didn’t suddenly turn bullish on the stock market. But in the midst of yesterday’s strong decline, the reasons for betting on the downside disappeared – or rather, they played out.
By midday yesterday, the Volatility Index (VIX) had spiked over 30%. It was trading near 14. VIX option prices – which were previously skewed in favor of a higher VIX – weren’t pointing to a higher VIX anymore. And the overbought conditions on the 15-minute S&P 500 chart I showed you yesterday had drifted down closer to oversold.
In other words, the reasons I held a short position in the first place no longer existed. So, despite my personal bearish bias, it made sense to lock in a small profit on the trade and move to the sidelines. Then I could re-evaluate the new situation overnight.
What I noticed last night, though, looks more bullish for the short term than it does bearish.
For example, look at this daily chart of the S&P 500…
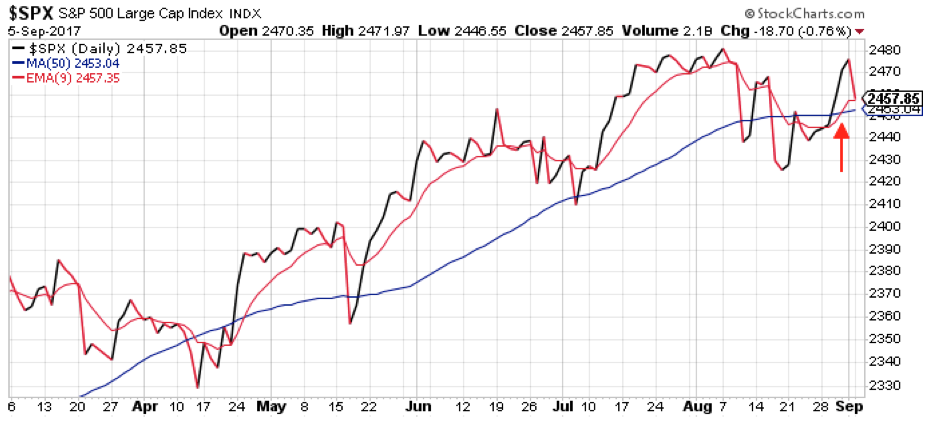
During last week’s rally in the S&P 500, the 9-day exponential moving average (EMA) crossed back above the 50-day moving average (MA) line. This “bullish cross” – if it’s not reversed immediately – often marks the end of a decline phase and the beginning of at least a short-term rally phase.
If the S&P had closed near its low of the day (2447), or at least below its 50-day MA (2453), then we could argue that the bullish cross was likely to reverse.
But buyers stepped up in the final hour of trading yesterday and the S&P rallied back up above its 9-day EMA and 50-day MA. That kept the bullish cross intact. And it makes it hard to argue a bearish case on this chart.
Now let’s look at the 60-minute chart of the S&P. Maybe we can find something bearish here…
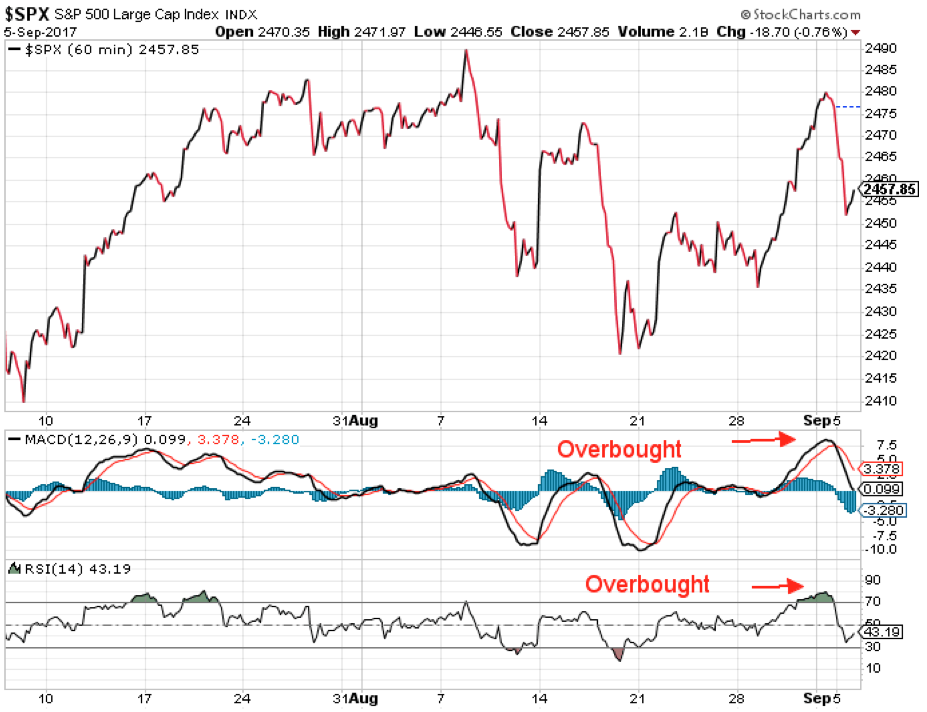
Heading into yesterday morning, both the MACD and RSI indicators were in extremely overbought territory. That supported the prospect of a decent pullback – which we got.
Now, while we could argue the 60-minute chart of the S&P looks like a bit of a bear flag – which would lead to one more push lower – the technical indicators are now in neutral territory. The market burned up a lot of fuel on yesterday’s decline.
This chart looks neutral to me. I wouldn’t initiate any new trades, either bullish or bearish, based on the current setup.
Finally, let’s look at the 15-minute chart of the S&P…
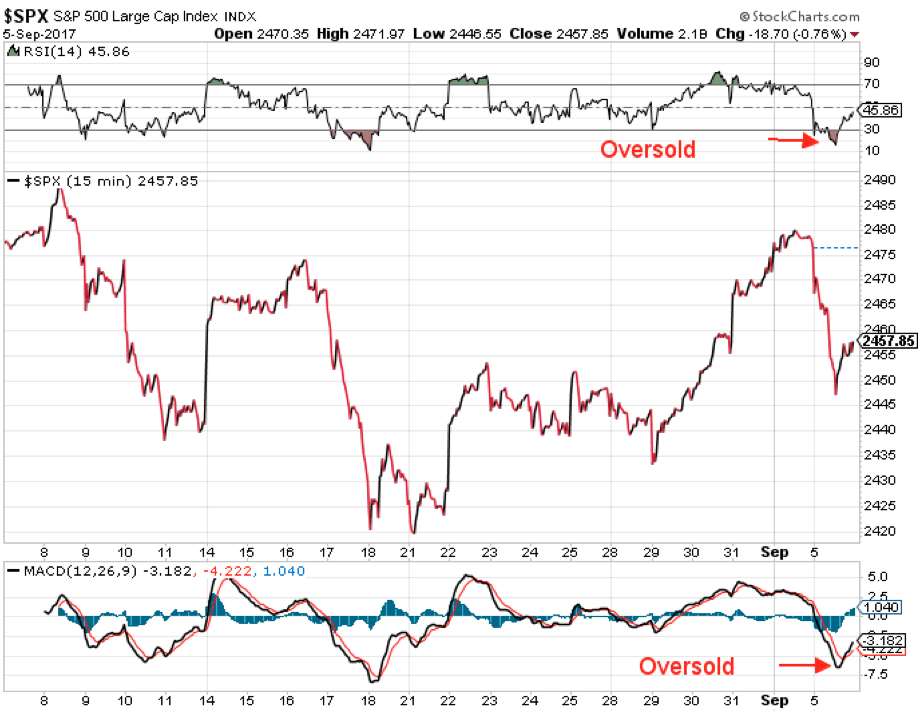
Like the 60-minute chart, this 15-minute chart of the S&P 500 looks like a bear flag. If it plays out, then it should lead to another push lower for the stock market.
But, at the lows yesterday, the MACD and RSI indicators on this timeframe dipped well into oversold territory. Now, even if the market sells off again and retests yesterday’s lows, these indicators are poised to form positive divergence (meaning they won’t retest their lows).
Remember, I pointed to the negative divergence that formed on Friday’s highs as a reason to hold onto my short trade yesterday morning. If positive divergence now forms on the next decline, it’s likely to mark a good point at which to start buying stocks.
Right now, this chart looks slightly bearish. But it could flip to bullish without much more downside action.
Taken all together… the daily chart looks bullish, the 60-minute chart is neutral, and the 15-minute chart is slightly bearish. That’s a neutral setup – which makes it hard to be either bullish or bearish right now.
The sidelines feel like a pretty good place to be.
Best regards and good trading,

Jeff Clark
P.S. Will you be holding cash on the sidelines with me heading into today? Send me your responses – along with any other questions or suggestions – right here.