
The stock market is doing exactly what it needs to do in order to play out the bullish scenario I outlined on Monday.
If you recall, the S&P 500 started the week at 2604. The 60-minute chart of the S&P 500 was showing a potentially bullish “inverse head and shoulders” pattern. A move above 2675 could spark a rally all the way back up to 2800 over the next few weeks.
Here’s an updated look at that chart…
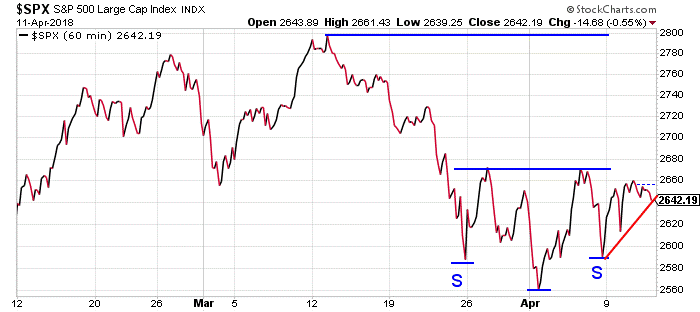
As you can see, the index rallied nearly all the way back up to the neckline of the pattern before pulling back a bit on Wednesday. That pullback, however, looks quite constructive to me.
You see, the market has held on to most of Tuesday’s big gains. And the pullback has helped to relieve some of the short-term overbought conditions – which helps to set the stage for another rally attempt and another shot at the 2675 level.
At this point, I’d argue that as long as the S&P 500 doesn’t drop below Tuesday’s intraday low near 2612, the odds favor the bulls.
The daily chart of the index also shows a potentially bullish setup. Take a look…

Since the start of April, this chart has formed a higher high and a higher low. One more push to a higher high would increase the chances of a new up-trend beginning and signal the end of the recent correction phase.
Tuesday’s rally nearly got us that second “higher high” – but not quite. So the jury is still out.
But despite yesterday’s pullback, the S&P is still holding above its 9-day exponential moving average (the red line). If that level holds as support, then the bulls maintain the momentum. Stocks are likely to move higher.
Of course, there are no guarantees. And if the S&P drops below the 2612 level, then all bets are off.
For the moment, though, I like the chances of an upside breakout and a solid rally over the next few weeks.
Best regards and good trading,

Jeff Clark
Reader Mailbag
How have you traded this week’s market action? Placed your bets on a strong move higher? Let us know right here…