
Oil services stocks are on the verge of an explosive short-term move… Likely to the upside.
I wouldn’t blame you for being skeptical. Oil services companies have been in a long, painful downtrend since the peak at the beginning of 2017. The sector, as represented by the VanEck Vectors Oil Services ETF (OIH), has lost more than half of its value since then.
As a result, oil stocks have all but disappeared from the financial news headlines. Nobody is talking about them.
So, as contrarian traders, that means it’s time to take a closer look…
Here’s the daily chart of OIH…
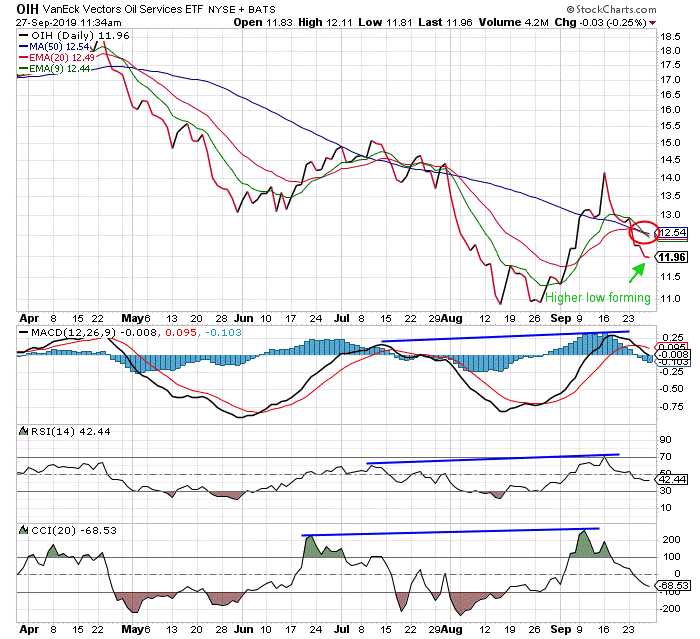
There’s a lot going on here… and all of it points to a bullish move in OIH. Let’s walk through it.
Regular readers will recognize the divergence on the momentum indicators (MACD, RSI, CCI) right away. These divergences are a strong sign of an imminent change in the short-term trend. And we can see this happening right below the OIH chart.
While OIH has made a lower high from early July to early September, the momentum indicators have made higher highs. That tells us that even though the price is lower, there’s positive momentum building in the background.
This is why technical indicators are so valuable to traders. You can’t see these sorts of things just looking at a stock price. And that’s the edge traders have over typical buy-and-hold investors.
The next thing to look at, and what has me most convinced about a bullish move in OIH, is the coiling action in the various moving averages – the 9- and 20- day exponential moving averages, and the 50-day moving average.
When the EMAs trade above the MA, that’s another sign of bullish momentum. The opposite is a sign of downside momentum.
But when the three moving averages coil together (circled red), it signals that energy is building for a big move. And in this case, the big move is likely to be up.
Here’s why…
Right now, the price of OIH is forming a “higher low” on the chart. This is constructive action. It means that the price is finding a higher short-term bottom.
If we were seeing the chart form a “lower high” along with coiling action in the moving averages, like what happened back in late July, it would be a different story. That was much more clearly bearish. Plus, we didn’t have the same divergence in the momentum indicators back then.
To me, all this says that oil services stocks are due for a short-term rally this coming week. If the price makes a higher low and turns up, we could be in for a move that eclipses the most recent high at about $14.20. That would be about a 20% move from yesterday’s close.
So, traders looking for something to play on the long side this week should keep OIH at the top of their list.
Regards,
Mike Merson
Managing Editor, Market Minute
P.S. If you’re not already a member of Jeff Clark’s newest project, Jeff Clark Trader, there’s never been a better time to join.
Once a month, Jeff sends a high-potential option trade to his subscribers. That alone is more than worth the $19 asking price.
But that’s just the tip of the iceberg. Jeff’s special reports and video training series not only show you the basics of option trading… They set you on the path to trading for yourself, and retiring comfortably no matter what the market does.