
The S&P 500 is at a critical spot.
For the past three weeks, the index has chopped around in a tight trading range, building up energy for the next big move.
The S&P plunged 12 points on Monday – in as much as you can call a 0.5% decline a “plunge” – where it tested the bottom of the trading range. Then the index “rocketed” 10 points higher yesterday – where it tested the top of the range.
Look at this 15-minute chart to see what I’m talking about…
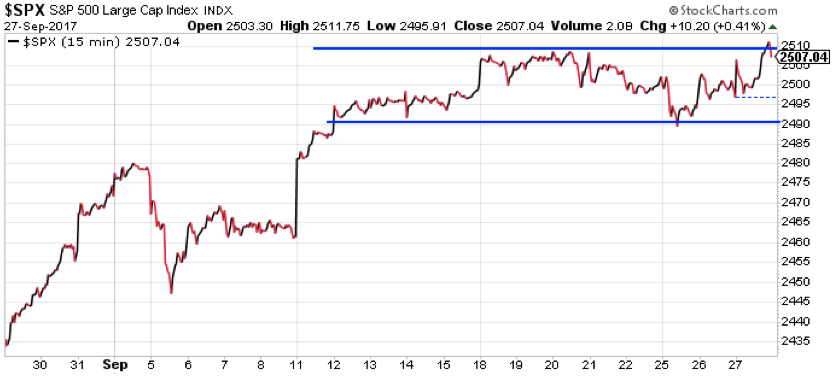
If this pattern continues, then the next move should be another dip down toward the bottom of the trading range.
But I think there’s a bigger pattern about to play out. Let me explain…
Technology stocks tend to lead the market. Indeed, it has been the strength in the technology sector that has provided the biggest boost to the broad stock market this year. And it was largely the selloff in tech stocks on Monday that caused the “plunge” in the S&P 500.
Of course, tech stocks bounced back hard yesterday, and we got a corresponding pop in the broad stock market.
So… my point is that the technology sector is likely to lead the next big move in the stock market. And that’s where we have a problem.
Look at this chart of the Technology Select Sector SPDR Fund (XLK)…
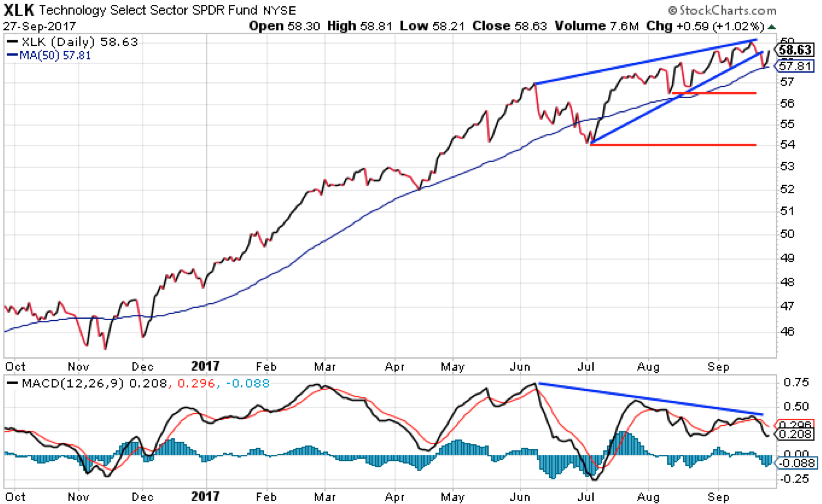
For the past few months, XLK has been tracing out a bearish rising wedge pattern on the chart. The MACD momentum indicator has been diverging negatively as well (meaning that as XLK has been making new highs, the MACD has failed to make new highs).
This sort of pattern usually breaks to the downside. And that’s what happened on Monday.
Rather than producing a sharp and sudden selloff, though, XLK found support at its 50-day moving average (MA) and then bounced.
Oftentimes, that’s what happens when a strong stock first breaks down from a bearish pattern. Stocks that are in strong uptrends usually don’t break through that support on the first attempt. And it’s quite common for stocks to bounce off that initial support level.
Since Monday, XLK has bounced. It’s now trading right back up to the former support line of the rising wedge pattern. This level is now resistance.
If XLK is going to turn back down and head lower, then this is where the bounce should end. And, if XLK turns lower from here, then there’s a stronger chance it will break below the support of its 50-day MA on the second attempt to do so. That will bring the next support line, at $56.50, into play.
That will be bad news for the broad stock market.
Look at this daily chart of the S&P 500…
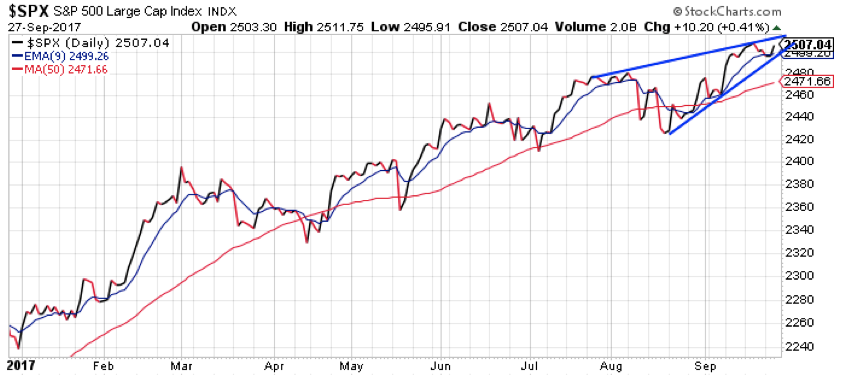
This chart is showing a similar bearish rising wedge pattern.
If the technology sector turns lower, then the S&P is quite likely to break this wedge to the downside. At a minimum, that should bring the 50-day MA, at 2472, into play.
For the next few days, keep an eye on tech stocks. They’ll lead the next big move in the stock market.
Best regards and good trading,

Jeff Clark
P.S. One of the best things about my Delta Report strategy is that it works in any market – whether it’s going up, down, or sideways. It’s how my readers are able to reap gains like 185% in just 24 hours… no matter what’s happening with the S&P 500.
If you’d like to learn more about my strategy and how it can work for you, click here.
Reader Mailbag
As always, if you have a question, comment, or suggestion that you’d like featured in our Reader Mailbag, send it right here.
In today’s Mailbag, Jeff answers a question from a reader who just recently started trading options…
I am a new options trader (early 2017) and learning a LOT from your service. I recently became a LIFETIME subscriber. I am taking several courses from Investools courtesy of TD Ameritrade (i.e., Stock Investing, Technical Analysis, and Options Strategies). I use whatever resources I can to learn, including Investopedia and Option Alpha. However, I still have some questions about the MACD chart if you would help me out.
I understand that the MACD is calculated as the shorter-length EMA (say, 12 days) minus the longer-length EMA (say, 26 days). This then is plotted as the “indicator” line on the graph. Next, the short-term EMA (say, 9 days) is taken of the MACD “indicator” which yields the “signal” or “trigger” line plotted on the graph.
Is it correct to say that the EMA(12)-EMA(26) IS the MACD (value)? Finally, when looking at your charts (see example below), am I correct that the black line is the MACD “indicator,” the red line is EMA(9) “signal” or “trigger” line, and the blue histogram values are calculated as the difference between the black and red values along the x axis?
– Douglas
Hi Douglas. Thank you for your question. Everything you state is correct. Clearly, you’ve done your homework.
And you must enjoy studying the fine details of technical analysis. Good for you. It will help make you a better trader.
But, for most folks, I suspect you may be making things a bit more complicated than necessary. You don’t need to know how a watch is made in order to tell time. You just need to know how to read the big hand and the little hand.
Similarly, you don’t really need to know how technical indicators are calculated. You just need to know how to read them.
For example, the MACD indicator helps measure the momentum of a stock’s current trend. If the MACD is diverging from the trend, then it’s a warning that the trend may be ready to reverse. Then, when the black line crosses the red line, that’s often a signal that the reversal has begun.
The blue MACD histogram is just one more way of measuring divergence.