
The bulls had the easy-money bet last week.
The S&P 500 was oversold last Monday. It was trading more than 40 points below its 9-day exponential moving average (EMA) line – an extreme condition.
And the Volatility Index (VIX) had just triggered a new “buy” signal for the broad stock market. So, when stocks dipped even lower on Monday morning, it gave bullish traders a low-risk setup to bet on a bounce.
That bet paid off well as the S&P 500 rallied from a low of 2417 on Monday to a high of 2455 on Wednesday.
This week, though, we’re betting with the bears. Here’s why…
Late August through late October tends to be a weak period for the stock market. Short-term weakness, which often reverses quickly during other times of the year, tends to persist during this period.
For example, look at what happened last year…
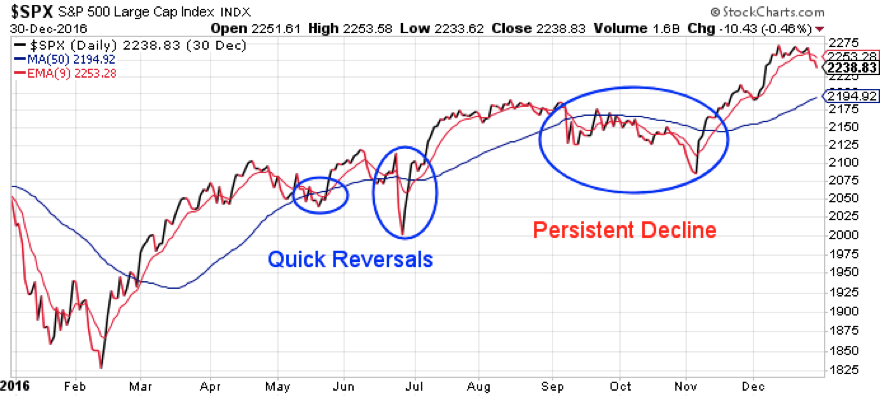
Three times last year the 9-day EMA crossed below the 50-day moving average (MA). This “bearish cross” – if it’s not reversed quickly – often marks the start of an intermediate-term decline phase, where the S&P moves lower for several weeks.
Traders need to understand, though, that a bearish cross is a lagging indicator. It occurs AFTER stocks have already declined. By the time the 9-day EMA dips below the 50-day MA, stocks are already oversold. They’re vulnerable to an oversold bounce. So, it’s usually a bad idea to short an index right as the bearish cross occurs.
It’s a better strategy to wait for the inevitable oversold bounce to occur. Then, as the index makes its way back up to the moving average lines, and the market works off the oversold conditions, traders can take a lower-risk short position. They’ll either profit as the market turns back lower, or they’ll stop out of the trade for a small loss if the 9-day EMA crosses back above the 50-day MA – a “bullish cross.”
On the chart, you can see the quick reversals that happened in May and June last year. Traders who shorted the S&P when the index approached its moving averages from below suffered relatively small losses if they closed those trades when the moving averages completed a bullish cross.
But – and this is the main point for this week – the bearish cross last September produced a persistent decline that lasted for several weeks. Traders who shorted the S&P when it popped back up to its moving averages in mid-September had solid profits by early November.
Now, let’s take a look at the current chart of the S&P 500…
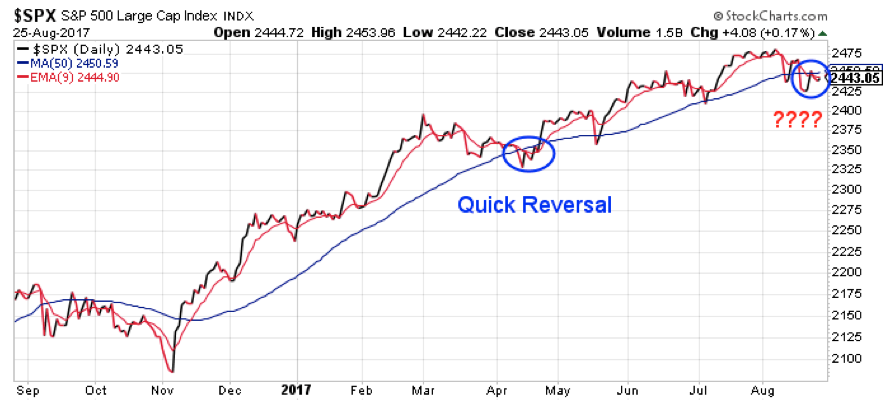
The moving averages completed a bearish cross during the market weakness from two weeks ago. Last week, though, we got the oversold bounce back up to the moving averages.
This gives traders a low-risk setup for a short sale. We can short the S&P right here in the 2445-2450 range. If the 9-day EMA crosses back above the 50-day MA, thereby completing a bullish cross, we can cover the short position for a relatively small loss.
On the other hand, if the seasonal weakness kicks in and stocks move lower from here, then we have a trade we can probably hang onto for a few weeks and look to profit from as stocks decline.
Best regards and good trading,

Jeff Clark
P.S. Have you ever used patterns like these when trading the broad market? How did it work out?
Send me your trading stories – along with any other questions or concerns – right here.