
Gold stocks suffered an ugly reversal yesterday.
After starting the day with a 2% pop higher, the VanEck Vectors Gold Miners ETF (GDX) slowly drifted back down – unchanged on the day before the FOMC announcement on interest rates at 2:00 p.m. ET.
And then… WHAM! Sellers started pounding gold stocks. GDX ended the day down more than 3%.
More importantly, the GDX/Gold ratio chart I showed you last week broke down in a big way. Take a look…
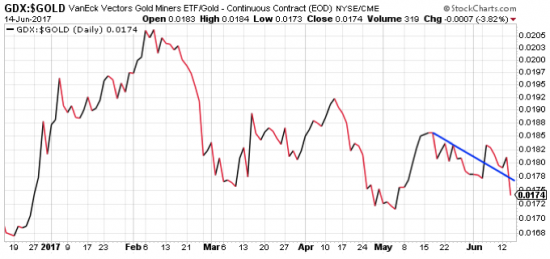
Remember, when this chart is moving higher, gold stocks are performing better than the metal. That’s bullish for the gold sector. When it’s moving lower, gold stocks are underperforming gold. Typically, that’s bearish for the gold sector.
Last week, this ratio chart broke above its resistance line and it looked like the gold sector was ready to rally. But yesterday’s action turned the ratio chart back down. So the rally has been postponed.
Here’s an updated look at GDX…

For the past four months, GDX has been stuck in a contracting trading range between $21 and about $24 per share. Last week, when the GDX/Gold ratio chart broke out to the upside, GDX rallied up to its resistance line. Then it stalled.
GDX needed to get above the $24 level in order to kick off a new intermediate-term rally in gold stocks. But it didn’t happen.
Now, after yesterday’s ugly reversal, it looks like GDX may need to come back down towards the support line at $21 per share one more time. Either that, or GDX needs to spend a few days chopping back and forth in order to build up energy to attempt another breakout.
Either way, traders can be patient when adding exposure to the gold sector.
Having said that… for the very short term, GDX is now quite oversold and might be setting up for a quick intraday bounce (maybe today). Look at this 15-minute chart…

Look at the MACD momentum indicator on the bottom of the chart. The blue arrow points to the current extreme oversold condition. This could cause a quick bounce in GDX sometime today – perhaps back up to the $22.70 level or so.
But it will only be a short-term bounce. GDX still has lower to go.
Look at the previous two times the MACD indicator reached oversold levels (May 18 and June 8). That condition led to a quick bounce. But GDX had to come back down one more time and create positive divergence on the MACD indicator before it could mount a more sustainable rally.
Right now, there is no positive divergence. So any bounce from here is likely to fail. GDX will come back down and form a lower low while the MACD indicator forms a higher low. That will create the positive divergence we need to give us a good trading setup to buy.
So, here’s the bottom line…
Despite the potential for a quick, short-term bounce today, GDX has lower to go. Look for a move closer to $21 per share over the next few days. If it reaches that level while creating positive divergence on the intraday charts, AND if the GDX/Gold ratio turns higher in the process, then we’ll have a lower-risk setup for buying gold stocks.
I’ll update Delta Report readers on these trends throughout the day on Jeff Clark Direct.
Best regards and good trading,

Jeff Clark
P.S. If you have any questions, concerns, or great trading stories you’d like to share, be sure to send them to me right here.