
This would be a good week for a surge in volatility.
It is still October, after all – which is often a volatile month. And it’s option expiration week in October – which only adds to the potential for volatility.
In fact, the S&P has had a weekly trading range above 5% this week in four of the past 20 years (1998, 2002, 2008 and 2011). That sort of a move would be quite a change from the action we’ve seen so far this month.
For the past two weeks, the S&P 500 has been stuck in a 12-point trading range. That’s a two-week range of just 0.5% – one of the lowest weekly volatility ranges ever recorded.
This listless action has turned most traders complacent. Almost no one is worried about a selloff – whether it’s just for one day or something more significant. And in a market that seems determined to frustrate the most participants possible, a large surge in volatility would do the trick.
And, frankly, we do have the right setup for it. Take a look at this chart of the Volatility Index (VIX) along with its Bollinger Bands…
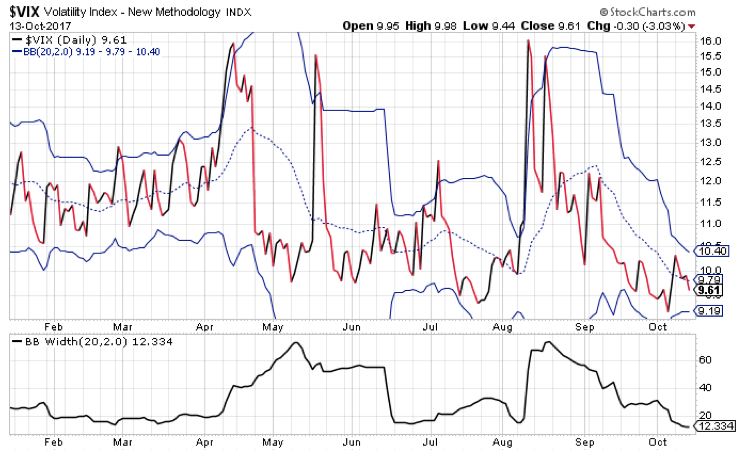
Most of the time, technical analysts use Bollinger Bands (the blue lines on the chart) to show the most probable trading range for a stock or an index. But, on the VIX, we can use the Bollinger Bands to determine how much energy is built up or spent. That allows us to prepare for the next move.
You see, volatility contracts and expands. Periods of low volatility are always followed by periods of high volatility, and vice versa. By looking at the Bollinger Band width – the distance between the lower and upper bands – we can determine where we are in the volatility cycle and prepare for the next move.
Look at the lower graph on the chart, which displays the Bollinger Band width. On Friday, the Bollinger Bands closed with only a 12.3% difference between the upper and lower bands. That is the smallest distance we’ve seen all year.
The Bollinger Bands are contracting. They’re coming together and building energy for the next big move in the VIX.
We had a similar situation in mid-June just before the VIX spiked 20% higher. And, in early August, contracting Bollinger Bands preceded at 60% surge in the VIX.
Of course, we can’t say for sure that volatility will spike this week just because the Bollinger Bands are contracting. They contracted for two full months before the VIX spiked higher in April.
But, like I said earlier… it is October, and it’s option expiration week. So, it seems to me that it’s probably better to be prepared for more volatility this week and not get it… than to be unprepared for a spike in volatility and then get it.
Best regards and good trading,

Jeff Clark
P.S. How are you preparing for a potential surge in volatility? Send me your thoughts, questions, or suggestions right here.
Reader Mailbag
Your Option Glossary is excellent. Thanks for making it available to the public!
– Kurt
You hit the nail right on – my wife and I believe you are 100% right. There are so many items we would want to go to our nearby stores to make our choice for.
– William