Last Wednesday, I wrote about how the Dow Jones Transportation Average (DJTA) was setting up for a quick trade to the upside.
The DJTA has traded right into my cited target range of 16,418 to 16,588 (red lines on the chart below). It’s now time to take a step back and let this sector cool off a bit.
Equity markets ended the week on a high note… The S&P 500 ended the week up 6.16%, with the Nasdaq adding 8.41%, and the DJTA up 8.3%.
Clearly, broader market sentiment is starting to improve…
And while I think stocks have bottomed out, the short-term technical analysis suggests that we’re due for a pullback.
Let‘s look at an updated price chart of the DJTA to see what I mean…
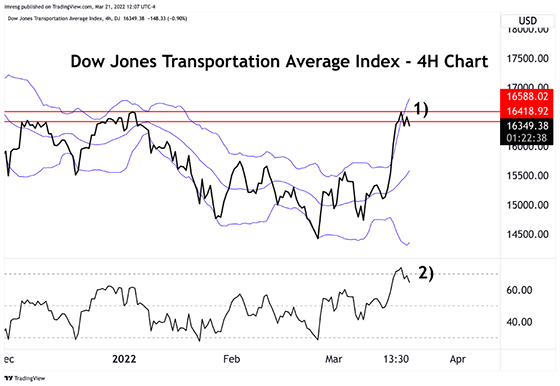
Since breaking out of the inverted head and shoulders pattern I identified last week, the DJTA has shot straight up with a great deal of momentum.
There are two key items I’ve highlighted on this chart:
-
Prices were able to temporarily break through the upper Bollinger Band (blue lines)…
This is an important signal because Bollinger Bands are a great measure of a market’s volatility.
When prices break through either the upper or lower band, it signals that the market is overextended and in need of a breather.
Think of it like a sprinter that’s running a 100-meter dash with an elastic band tied around their waist.
If they pick up enough speed, they’ll be able to complete the dash… but once they stop running, the band is going to snap them backwards.
This is what’s going on with the Dow Transports… Notice that prices have now closed below the upper Bollinger Band and are steadily drifting lower.
-
We have an overbought reading on one of my favorite momentum indicators – the Relative Strength Indicator (RSI), which lets you know when a market has reached overbought or oversold conditions.
However, an overbought reading on its own doesn’t do us much good. Markets hit overbought readings all the time without selling off.
That’s why it’s important to combine the RSI with other technical tools like Bollinger Bands.
|
Free Trading Resources Have you checked out Jeff’s free trading resources on his website? It contains a selection of special reports, training videos, and a full trading glossary to help kickstart your trading career – at zero cost to you. Just click here to check it out. |
Combining the Bollinger Bands and RSI creates a powerful analysis that’s usually worth respecting.
So, I’ll look for the DJTA to pull back closer towards the middle Bollinger Band (around 15,650).
That would be a healthy pullback that should set us up for the next bullish leg.
I’ll continue to keep an eye on the index to alert you once I see another great opportunity forming.
Happy trading,
Imre Gams
Analyst, Market Minute
Reader Mailbag
In today’s mailbag, Jeff Clark Trader members Christina and Eric thank Jeff for his services…
Hi Jeff. Thank you for all you do. I’m learning a lot and feel so grateful to you all.
– Christina Y.
Hello, I wanted to say your articles are well-written. I value your insights. Thank you.
– Eric B.
And now, Delta Report member Kathleen shares her thoughts…
I fully enjoy reading Jeff’s morning updates and alerts which truly gives me a feel for macro events underway, and his very interesting recommendations. I’ve benefitted from several assigned positions in gold (for which I’m truly thankful) and look forward to further recommendations in gold.
I am interested in Imre Gams’ recent essay on the DJTA index since transportation has been so badly beat up by the pandemic and recent events. At the same time, innovations in EV, AV, and AI are starting to disrupt transportation.
– Kathleen R.
Finally, Market Minute subscriber Tom shares his thoughts on Wall Street…
Hi Jeff, thanks for the guidance. When the “Fed-welfare queens” on Wall Street want to steal from the “serfs” they often rig the market perversely low or high before the opening bell. Then, they fill their gullets at the bell and run it in the opposite direction all day to make a killing.
Example: On Friday, March 18, they pulled everything down on Sunday and pre-open Monday. With especially pumpable stuff like NVDA, they set an obscenely low price around .26 at the open and it held there while they filled their tanks until just after 9:31 a.m. Then it went up 2,400% on the day.
I like to take a small WTF flyer on these and put in a limit order guess before the open that just missed filling. I filled on MSFT at .34 with the same strategy and it made about 150% by midday and then I got out.
– Tom C.
Let us know your thoughts – and any questions you have – at [email protected].