
Jeff’s Note: Today is the start of what I predict will be 44 days of hell. You see, due to a federal law, hundreds of stocks are set to experience one-day drops of 10%, 20%, 30%, or more…
When I correctly predicted the 2000, 2008, and 2020 crashes, few people believed me. But when stocks collapsed, it crushed the retirement dreams of millions of Americans. So please don’t take this warning lightly.
That’s why I want to prepare you for this crash using my “crash-proof” strategy that’s so reliable it’s been called “a stock market law of gravity.”
And I’ll go over everything you need to know tonight at 8 p.m. ET during my urgent presentation. Time is running out, so click right here to save your seat for free.
And read on about what analyst Clint Brewer says is in store for the economy and your portfolio…
Rates are expected to rise once again…
But this time, when the Federal Reserve meets next week to set interest rates, analysts expect the central bank to hike rates by just 0.25%.
That’s a marked slowdown from the last two meetings, where the Fed increased rates by 0.50% and 0.75%.
And the consensus view among economists is that the Fed will then pause its rate hiking campaign to assess the damage to the economy.
But you may be wondering… what damage? After all, the unemployment rate sits at 3.5%, which is among the lowest levels ever.
Plus, the Fed’s own estimate for GDP growth is running over 3.0% annualized for the most recent quarter. That’s hardly the stuff recessions are made of.
But those metrics are lagging economic indicators, meaning they don’t worsen until it’s already too late.
That’s why you should follow leading indicators. And despite their tough talk on inflation in public, my guess is that behind closed doors the outlook for the economy is making Fed officials nervous.
Let me show you the message coming from leading indicators, and what it means for the economy and stock market…
A Perfect Track Record
The Fed is mandated by Congress to keep prices stable, and people employed… hence the focus on inflation and the labor market when it comes to interest rate policy.
But the problem is that both inflation and employment are lagging indicators… meaning they’re among the last things to worsen when the Fed is deliberately slowing the economy as they’re doing now.
So, in order to stay one step ahead of where things are going, it pays to follow leading indicators of activity.
That’s why I closely follow the Conference Board’s Leading Economic Index (LEI). It’s comprised of 10 underlying metrics and historically leads key turning points in the economy by around seven months.
And here’s where the bad news comes in… LEI is falling sharply.
The drop is surpassing levels that have a perfect track record at predicting recessions. You can see that in the LEI chart below…
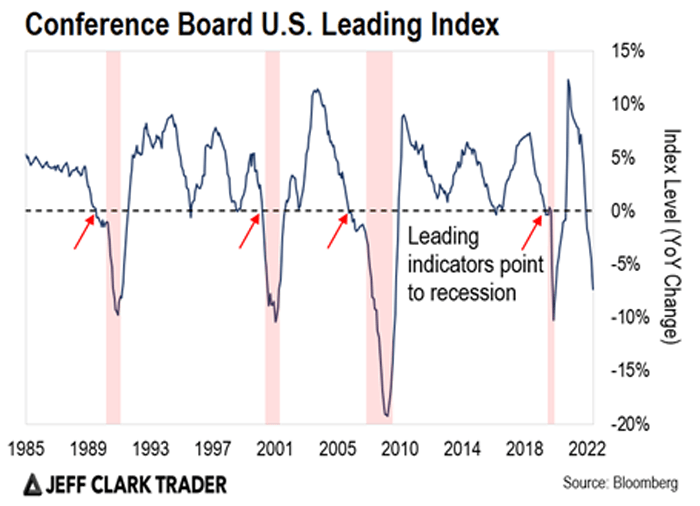
The blue line is the year-over-year (YoY) change in the LEI.
The dashed black line shows when the rate of change is crossing above or below zero. A cross below zero is when you should become concerned about the economic outlook.
The arrows on the chart mark when this happened historically.
And those red shaded areas are past recessions. That’s why the recent tumble into negative territory is concerning for the outlook.
But not only does a plunging LEI have implications for the economy, it also impacts your portfolio…
|
Free Trading Resources Have you checked out Jeff’s free trading resources on his website? It contains a selection of special reports, training videos, and a full trading glossary to help kickstart your trading career – at zero cost to you. Just click here to check it out. |
LEI’s Worst Phase
The level and direction of LEI in the chart above can impact stock market returns as well.
It comes down to different stages of LEI, and what that means for the direction of the economy.
Using those stages, here’s a table that shows the S&P 500’s return depending on the signal coming from the LEI…

You’ll notice that when LEI is falling and in negative territory, that’s historically been the worst combination for stock returns.
That’s because it signals a worsening economy ahead, which has implications for the earnings outlook. And that’s the stage we’re in now.
The good news is that the stock market’s best phase tends to happen next, when LEI finally bottoms out and turns higher.
So, while good times may lie ahead when LEI finally bottoms, it’s still time to be cautious when planning out your trades.
It’s important to be prepared in this type of market environment, which is why I urge you to join Jeff Clark’s special presentation tonight at 8 p.m. ET.
During it, he’ll go over a market anomaly that’s set to trigger a 44-day crash… it’s one of his most urgent warnings yet…
It’ll mark the beginning of an absolute disaster in the stock market. But Jeff will prepare you with the three stocks he’s targeting and show you his “crash-proof” strategy.
Just click right here to instantly reserve your spot for tonight.
Best regards,
Clint Brewer
Analyst, Market Minute
Reader Mailbag
In today’s mailbag, a reader comments on Imre Gam’s essay about the process you should apply to all your trades. If you missed his advice, you can find it right here.
The “Follow These Four Steps Before Rushing Into a Trade” was a great article. It should really help with my trading. Keep more like this coming.
– Jeremiah M.
Thank you, as always, for your thoughtful comments. We look forward to reading them every day. Keep them coming at [email protected].