
Gold stocks are on the verge of a large rally.
On Friday, I mentioned that we now have three reasons to be bullish on the gold sector. There’s the Bullish Percent Index buy signal. There’s the bullish setup in the Commitment of Traders report. And, the GDX/Gold ratio chart has broken out to the upside.
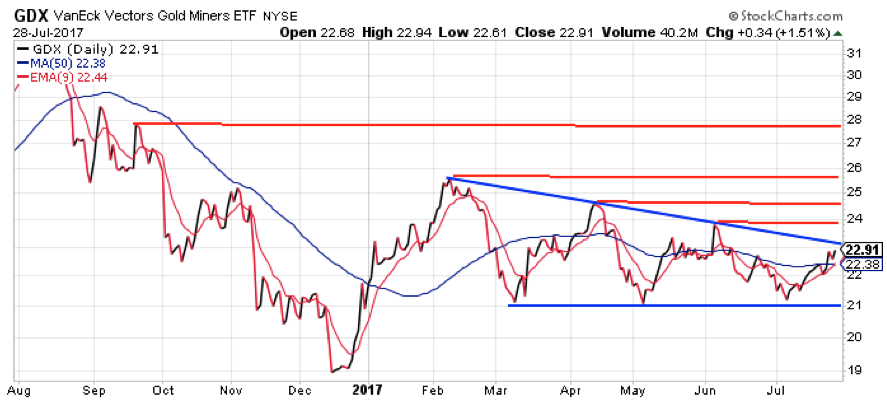
For today, let’s take a look at the chart of the VanEck Vectors Gold Miners Fund (GDX) and try to figure out just how far this new rally can go. Here’s an updated view of GDX…
There’s a lot going on with this chart. So let’s just take it one step at a time.
First off, notice that the last significant intermediate-term rally – when GDX clearly shifted from bearish to bullish – started in mid-December last year and ended in early February. It lasted about seven weeks, and it was good for a $7 rally in GDX shares.
If the current rally follows the same script, then it should last until late August – which is seven weeks from the low point in early July – and GDX should peak somewhere near $28.
But that’s a big “if.” The gold sector has to overcome several resistance levels in order to achieve that target price.
You can see that GDX is currently bumping into the resistance line of its recent trading range (the blue lines on the chart). A decisive close above $23.20 per share would signal a breakout from this pattern, and likely trigger a move up to the next resistance line at about $24.
I expect that could happen this week because… well… we have the three reasons to be bullish listed above. Plus, if you look closely at the chart, you’ll notice the 9-day exponential moving average (EMA) closed Friday just above the 50-day moving average (MA). This sort of “bullish crossover” often marks the start of a strong intermediate-term rally.
The momentum is now bullish for the gold sector. We should see higher prices this week.
GDX has additional resistance at $24.60 and $25.50, which line up with the April and February highs for the stock. It’s reasonable to expect sellers to step up as GDX gets close to those levels.
But as long as the 9-day EMA holds above the 50-day MA on any pullback, then there’s still a good chance of the stock hitting that $28 price target.
August should be a good month for the gold sector. Traders should be looking to add gold stock exposure on any weakness.
Best regards and good trading,

Jeff Clark
P.S. Are you bullish on gold? What reasons do you see for higher gold prices in the coming months? Write me your responses, and any other questions or comments, right here.