
Today I want to highlight four indicators that make up the recipe for the trading algorithms I use to predict the market’s direction with a high degree of confidence.
It’s an approach that allowed me to return 94% this past month as I traded overbought and oversold conditions on the NASDAQ.
So, let’s start with the Moving Average Convergence Divergence (MACD). The MACD is a key component in the toolbox of many traders, celebrated for its proficiency in tracking market momentum.
In a recent discussion with Market Minute colleague, Imre Gams, we delved into the significance of the MACD and its essential role in daily trading activities and how every trader should have the MACD in their toolbox. However, its frequent misuse and isolated application can lead to significant missteps, particularly in volatile markets.
To navigate these challenges more effectively, we advocate a more comprehensive strategy. This strategy involves the integration of MACD with the relative strength index (RSI) and the commodity channel index (CCI).
Our focus in this essay will be on applying these tools to one of our preferred S&P sectors, Consumer Discretionary (XLY), which has been a topic of interest in our recent discussions.
Common Misuses of MACD in Trading
Despite its popularity, MACD is often misapplied, resulting in costly trading errors:
-
Ignoring Market Context: Relying solely on MACD crossovers for buy or sell signals can be misleading without considering the broader market context.
-
Overemphasis on Zero-Crossings: Interpreting movements above or below the zero line as definitive bullish or bearish signals neglects the need for broader market analysis.
-
Disregarding Divergences: Failing to notice divergences between MACD and price action can miss critical insights into momentum changes.
-
Overtrading on Minor Fluctuations: MACD’s sensitivity, especially in volatile markets, can lead to frequent unprofitable trades if every minor fluctuation is acted upon.
Using MACD in isolation can result in incorrect timing and excessive trading. For example, MACD might signal a trend change without actual market movement, or miss nuances in price action, particularly when it suggests a bullish trend in a fundamentally bearish market.
So, how can you properly use MACD?
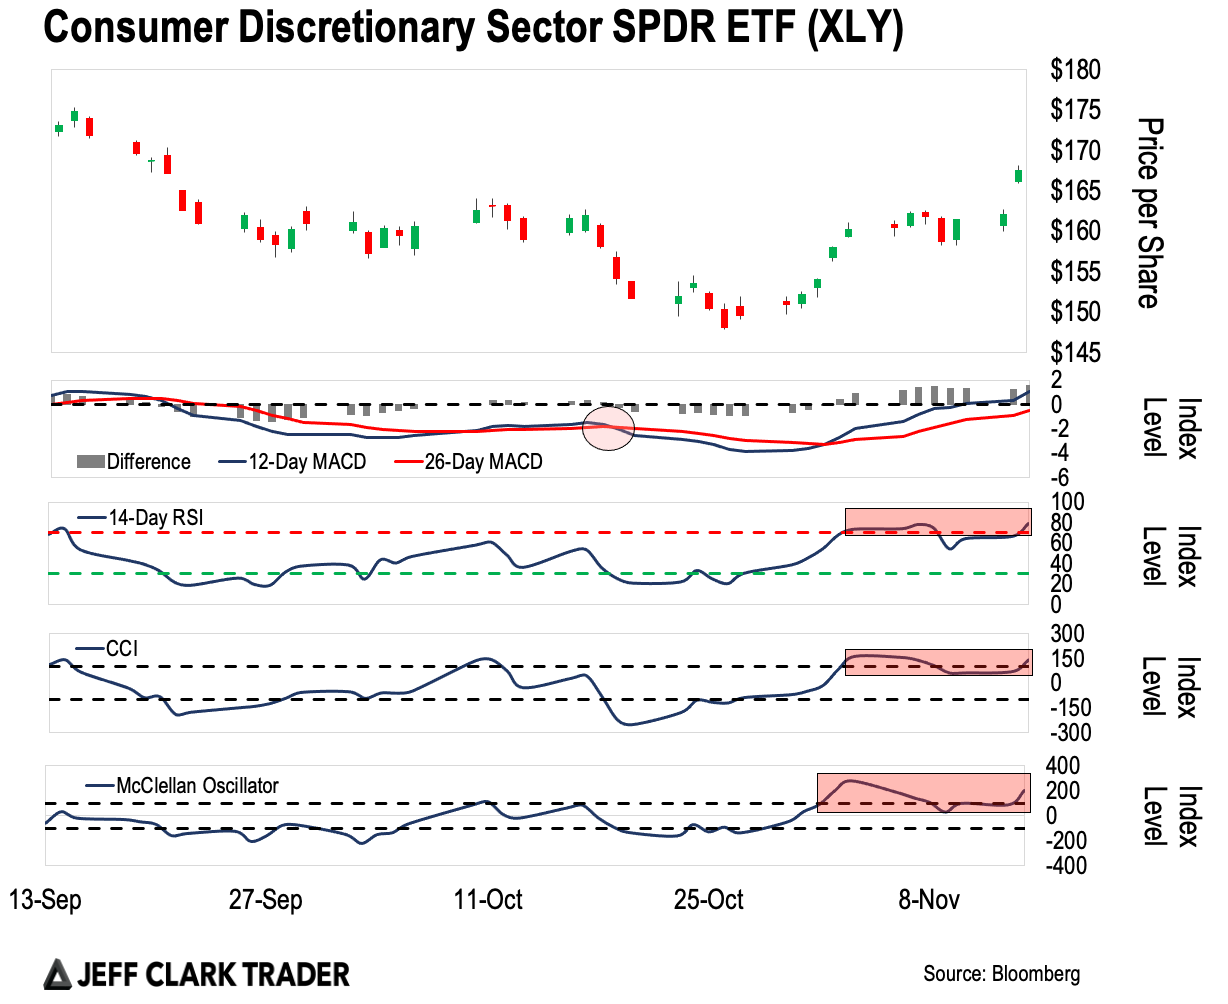
You should look for the 12-day line to cross over the 26-day line signaling a change in momentum. Usually just before the cross occurs, the distance between the two lines will decrease, signaling that soon the momentum will most likely slow down soon and reverse. The MACD charts label this distance as the “difference,” and you can see it labeled in the XLY chart below.
As I mentioned, using the MACD in isolation will not provide the complete picture, it’s important to combine MACD with other indicators for context.
Enhancing Analysis with RSI
Integrating the RSI with MACD adds a layer of market extremes analysis and helps to indicate when conditions are right for a change in direction.
While MACD tracks momentum, RSI identifies overbought and oversold conditions. This combination provides a clearer picture of potential trend reversals or continuations, as seen in our analysis of XLY.
Currently, RSI is in the 70s, the highest we have seen since late July.
For reference, XLY’s July top was immediately followed by a sharp pullback that cost XLY close to 10% of its value over the following month.
Take a look…

Confirming with Commodity Channel Index (CCI)
As we discussed last week, adding CCI enhances the strategy by confirming signals from MACD and RSI.
CCI’s focus on cyclical trends can validate or challenge signals from the other two indicators. For instance, if MACD and RSI suggest an upward reversal in XLY, but CCI indicates a downward trend, caution is advised.
Currently, the CCI for the XLY sector is over 140, showing extremely overbought conditions. And after its peak at 147 on November 7, and again over 140 this week, XLY is showing signs of exhaustion pointing to a reversal in the next week or two.
How the McClellan Oscillator Fits into the Full Picture
As Jeff Clark mentioned last Tuesday, the McClellan Oscillator showed the Nasdaq and S&P 500 as overbought. As a reminder, the McClellan Oscillators are an amazing way of comparing a stock, ETF, or index to the overall markets and providing insight into overbought or oversold conditions relative to those overall markets.
And as another ingredient to our “recipe,” the McClellan Oscillator for XLY hit a staggering 278 (0 is average and 100 is overbought) adding that major signs in this “recipe” have appeared and are pointing to the beginning of a pullback.
The only remaining element of the “recipe” is for the MACD to change direction, with the 12-day line to cross back below the 26-day line or at least for the difference for the two lines to decrease. You can see the red circle where the lines most recently crossed on October 7 and XLY fell -8.6%.
Understanding the Algorithmic Approach for Predictive Analytics
This multi-indicator approach mirrors a simple algorithm in trading. An algorithm is the combining of different indicators (“ingredients”) to form a comprehensive strategy (“recipe”).
By blending MACD for momentum, RSI for market extremes, CCI for cyclical trends, and the McClellan Oscillator for overbought or oversold market conditions, we create a well-rounded strategy for predicting which way the market will go in the coming weeks.
We call the “ingredients” of the strategy the indicators, the strategy, or “the recipe” the algorithm, and the full approach of creating the strategy predictive analytics.
Grasping the pitfalls of using MACD alone and recognizing the strengths of a combined approach is vital for sophisticated market analysis. Our multiple-indicator approach offers a deeper and more accurate understanding of market movements.
Free Trading Resources
Have you checked out Jeff’s free trading resources on his website? It contains a selection of special reports, training videos, and a full trading glossary to help kickstart your trading career – at zero cost to you. Just click here to check it out.
Successful trading is about strategically blending these tools to create an approach that is right about the future direction of the market a high percentage of the time.
Over the coming weeks, I look forward to providing actionable insights using these indicators.
Leveraging data for you,
Brad Hoppmann
Analyst, Market Minute
READER MAILBAG
How do you use these tools in your trading?
Let us know your thoughts – and any questions you have – at [email protected].