
Get ready to hold on tight…
The sharp, year-end rally has pushed several key market oscillators into extremely overbought territory.
Conditions are now ripe for a near-term pullback as this rally burns red hot.
Today I want to look at a few indicators to illustrate this.
First – as Jeff Clark recently noted – the McClellan Oscillator has surged above +60 into severe overbought levels on both the NYSE and Nasdaq. Based on historical patterns, readings exceeding +60 have frequently marked the beginning of short-term topping points like the declines in November 2022 and January 2023.
Now, let’s take a closer look at the S&P 500…
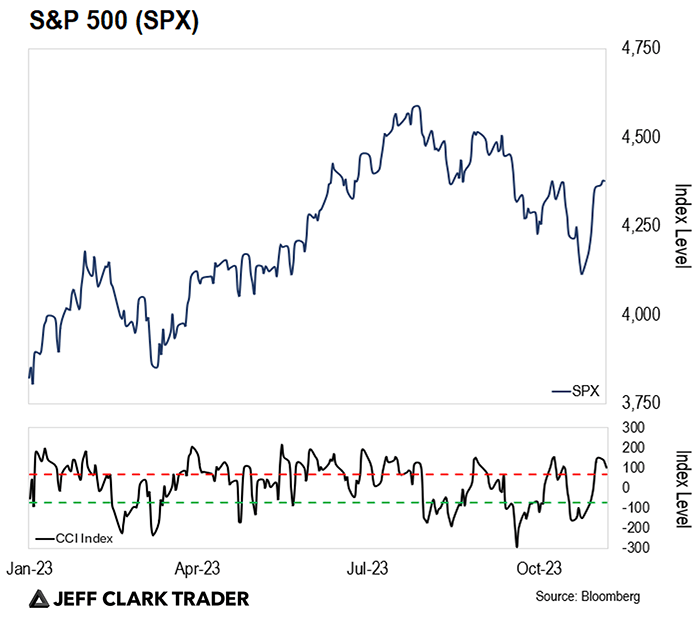
Last week, the 14-day CCI Index Indicator spiked above 100, confirming wildly overbought momentum (a reading above 100 means overbought, and below -100 means oversold). I use the CCI index as a confirmation to other oscillators like the McClellan Oscillator and RSI.
Jeff pointed out that the McClellan Oscillator hit extremely high levels on Friday.
The CCI index does a great job confirming overbought conditions. When the index comes back down below 100, it’s usually time to sell.
Over the past two years, whenever the CCI index has punched above 100 and confirmed overbought conditions, it has led to numerous short-term pullbacks in the following weeks, like in mid-July, the end of August, and mid-October.
Expect similar results in the next week.
The S&P 500 also crossed above its 50-day moving average Friday. Prices tend to pull back toward the mean following similar circumstances.
All these overbought oscillators suggest we’ve likely reached a tipping point where the risks outweigh potential rewards over the near-term.
The Opportunity Within Market Turbulence
While pullbacks may cause unease for some, embrace them as opportunities. During these market downturns, traders can find bargains and position themselves for future gains.
My algorithm has identified the retracement levels on the S&P 500 near 4,265 and Nasdaq near 14,800 for the time to buy this pullback.
These levels represent potential support, and history has shown that stocks often bounce back from these points.
Now, let’s look at one sector that could offer especially favorable entry points during this pullback: consumer discretionary stocks.
Consumer Discretionary Stocks: A Compelling Case
As the year ends, investors usually turn their attention to consumer discretionary stocks. That’s because they expect holiday shopping to push discretionary stocks higher. These companies cater to consumers’ desires rather than their basic needs, making them particularly sensitive to economic trends and year-end rallies.
|
Free Trading Resources Have you checked out Jeff’s free trading resources on his website? It contains a selection of special reports, training videos, and a full trading glossary to help kickstart your trading career – at zero cost to you. Just click here to check it out. |
The Consumer Discretionary Select Sector SPDR Fund (XLY) tracks this sector and could provide a diversified way to gain exposure to these stocks.
If XLY approaches 155, it could represent an attractive entry point for the sector and the stocks within the sector.

The next few weeks should bring about caution as the market corrects from the latest surge upward and savvy traders should stay nimble and keep an eye on these oscillators. Their extremes have repeatedly warned of rapid snapbacks.
Leveraging data for you,
Brad Hoppmann
READER MAILBAG
Are you watching discretionary stocks?
Let us know your thoughts – and any questions you have – at [email protected].