
The year-end rally started with a bang last week.
The S&P 500 gained nearly 6%. The index traded higher for five straight days and closed each day near its high for the session.
It hardly suffered any intraday pullbacks at all.
So traders who didn’t buy into the oversold conditions of the previous week are now stuck having to chase stock prices higher into overbought conditions… Or risk missing out on the market action during an often bullish time of the year.
But as we’ve seen so many times, it’s rarely a good idea to buy stocks into extremely overbought conditions (or to sell them when they’re oversold).
It takes patience to wait for it, but the market almost always presents a second chance to buy. And traders may get that chance over the next few days.
Take a look at the McClellan Oscillators for the NYSE (NYMO) and the NASDAQ (NAMO)…


These are momentum-based indicators that help determine overbought and oversold conditions.
Readings of more than 60 indicate severely overbought conditions and often preceded declines in the markets. Readings of less than -60 express extremely oversold conditions and usually lead to strong bounces in stock prices.
Both of these indicators closed in extremely overbought territory on Friday. This is only the third time in the past year that both the NYMO and the NAMO have been above 60 at the same time.
Here’s how the S&P 500 (SPX) performed after the two previous times…
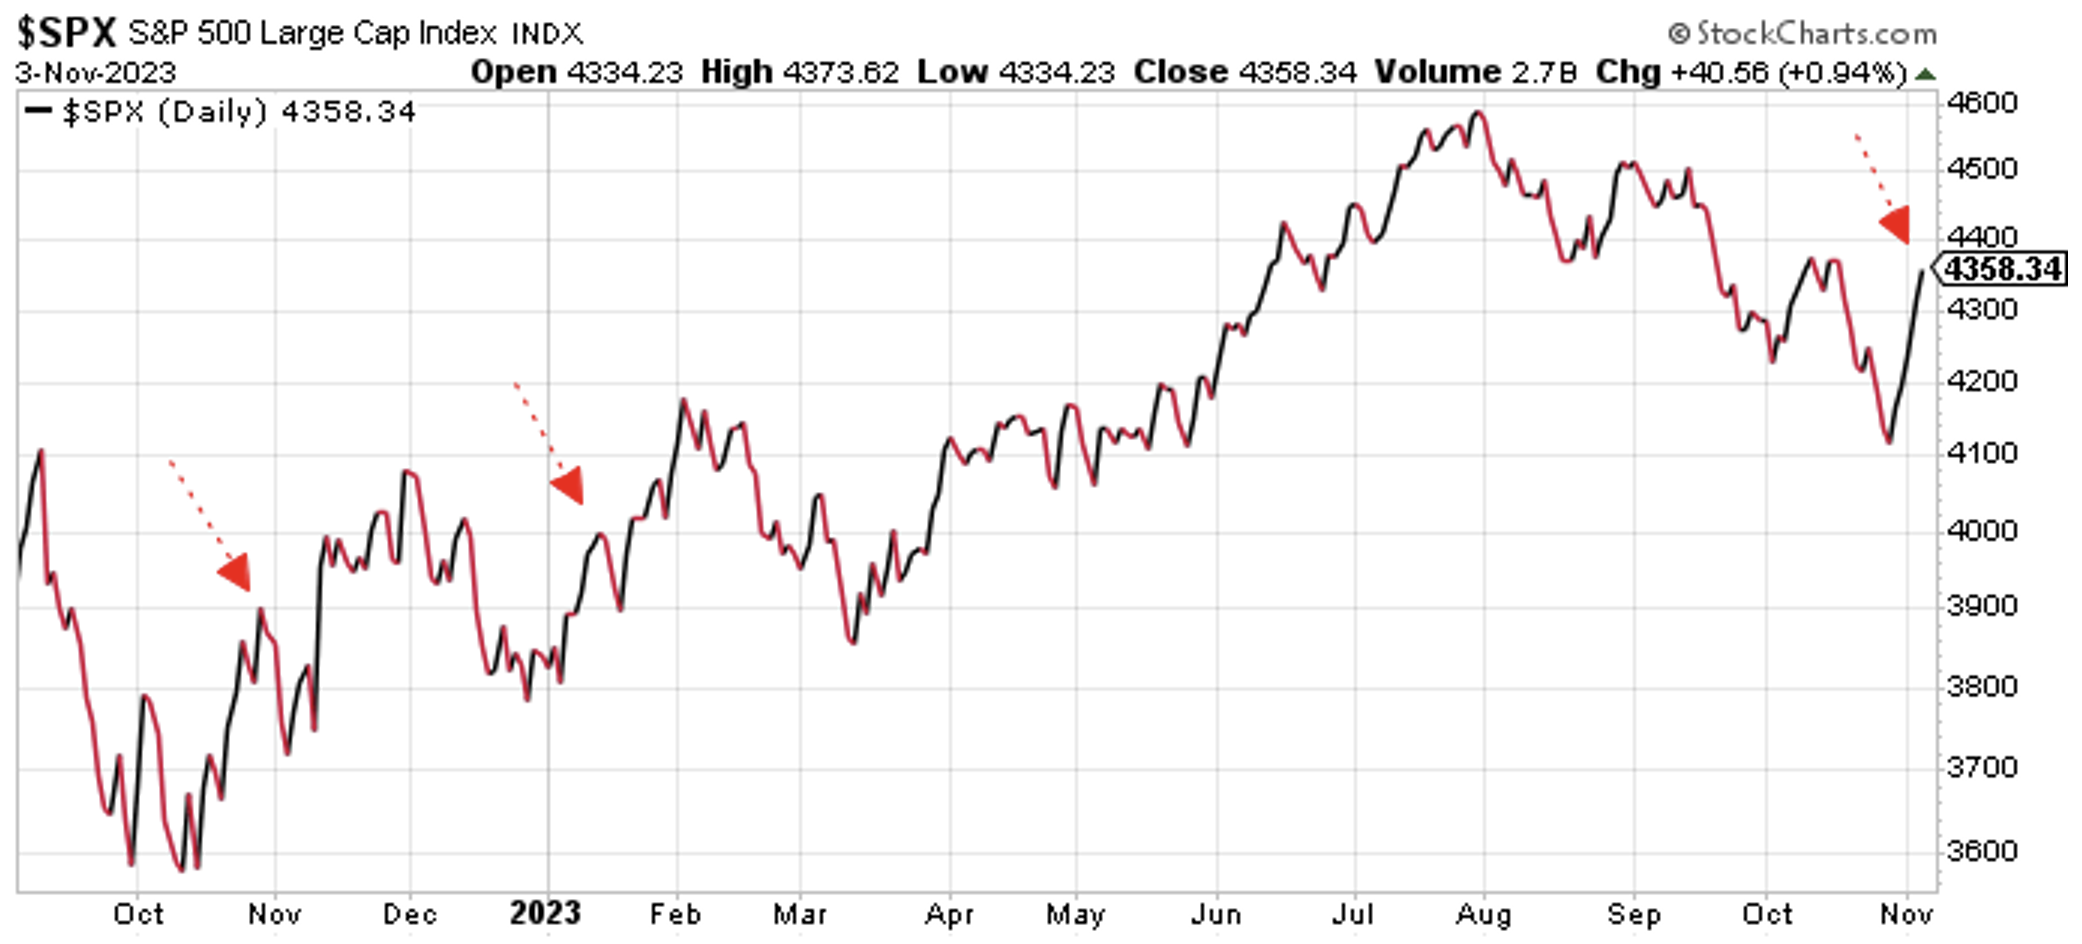
In both cases (red arrows), the S&P 500 declined almost immediately after the NYMO and NAMO hit extremely overbought conditions at the same time. Each decline retraced about half of the rally that created those overbought conditions.
|
Free Trading Resources Have you checked out Jeff’s free trading resources on his website? It contains a selection of special reports, training videos, and a full trading glossary to help kickstart your trading career – at zero cost to you. Just click here to check it out. |
But here’s the important part…
Following those declines, the index entered an even stronger rally phase and traded sharply higher a few weeks later.
If a similar pattern plays out this time, then the S&P 500 could trade down to about the 4260 level over the next few days. That sort of a move would give back about half of last week’s rally.
It would also relieve the extremely overbought conditions on the McClellan Oscillator. And it would set the stage for an even stronger rally over the next few weeks.
In other words, traders who missed the chance to buy ahead of last week’s rally should get a second chance to put money to work on the long side sometime in the next several sessions.
Best regards and good trading,

Jeff Clark
READER MAILBAG
Did you buy ahead of last week or are you watching for this second chance?
Let us know your thoughts – and any questions you have – at [email protected].