
Gold stocks are ready to run higher.
That’s a big difference from how they looked one month ago when we last looked at the gold sector. Back then, you may recall, the VanEck Vectors Gold Miners Fund (GDX) was trading around $22.20, and the outlook was mildly bearish.
Here’s what I wrote back then…
GDX has lower to go. Look for a move closer to $21 per share over the next few days. If it reaches that level while creating positive divergence on the intraday charts, AND if the GDX/Gold ratio turns higher in the process, then we’ll have a lower-risk setup for buying gold stocks.
Sure enough, GDX tagged the $21 level last Friday. It found support there, bounced off of it, and has put on a nice 3% rally over the past three days.
And… if the GDX/Gold ratio chart can push higher from here, then the gold sector may be on the verge of a strong intermediate-term rally that lasts for the next several weeks.
Here’s an updated look at the GDX/Gold chart…
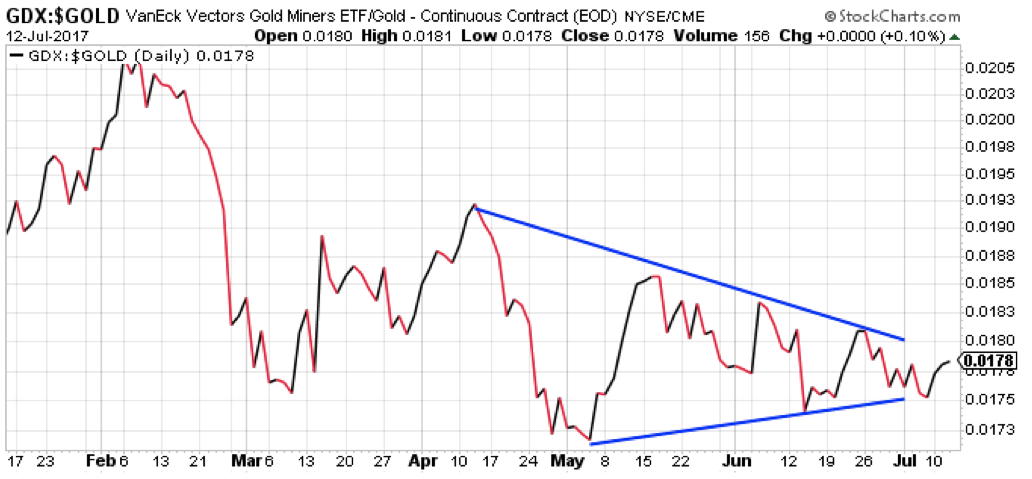
Remember, when this chart is moving higher, gold stocks are performing better than the metal. That’s bullish for the gold sector. When it’s moving lower, gold stocks are underperforming gold. Typically, that’s bearish for the gold sector.
For the past three months, this chart has been forming a consolidating triangle pattern. The sector is building energy for its next big move when it breaks out of the triangle one way or another.
The GDX/Gold ratio is already trading near its historical low. So, while it could happen, I think the odds of a downside break are low.
Instead, I think we’re more likely to see the GDX/Gold chart break out to the upside. That would kick off a new rally phase where gold stocks outperform the action in gold. And it could lead to substantial gains for gold stocks.
Best regards and good trading,

Jeff Clark
P.S. As always, if you have questions about option trading, suggestions for the Market Minute, or want to share some great trading stories, send me a note right here.