
The gold sector is on the verge of generating its first sell signal since 2016.
Gold stocks have had an amazing run higher over the past few months. The sector has been much stronger than I anticipated. And, the current rally has lasted much longer than I thought it would.
But, the gold sector remains vulnerable to a sharp and swift pullback. And even though my mom isn’t talking to me these days because I talked her out of buying gold stocks last month, my advice to her would still be the same today…
You will have a better opportunity to buy gold stocks at lower prices in the weeks and months ahead. One of my favorite gold-stock timing indicators is on the verge of a sell signal.
Take a look at this chart of the Gold Miners Bullish Percent Index ($BPGDM)…
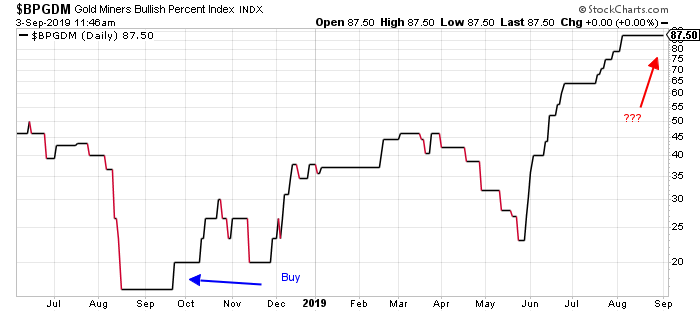
A bullish percent index is a gauge of overbought and oversold conditions. It measures the percentage of stocks in a sector that are trading in a bullish technical formation. Since it’s measured as a percentage, a bullish percent index can only reach as high as 100 or fall as low as zero.
Typically, a sector is extremely overbought when its bullish percent index rallies above 80. It’s extremely oversold when it drops below 20. Trading signals get triggered when the index reaches extreme levels and then reverses.
For example, last September, the $BPGDM turned higher from a deeply oversold reading of 13. That action triggered a “buy” signal. At the time, the VanEck Vectors Gold Miners Fund (GDX) was trading for a little less than $19 per share. Yesterday, GDX closed around $30.50.
It took a while to get going, but that turned out to be one heck of a buy signal.
Today, though, things look a little different.
The $BPGDM is trading above 87. That indicates an extremely overbought condition.
It hasn’t turned lower. So we don’t yet have a “sell” signal. But, the gold sector is clearly overbought. And with GDX trading nearly 50% higher than where it started the year, now is probably not a good time to be buying into the sector.
The last time we got a $BPGDM sell signal was back in August 2016. That also happens to be the last time the Commercial Trader net-short interest was over 330,000 contracts. That was also the last time GDX was trading above $30 per share.
Two months later, GDX was back down to $23.
Now, I’m not saying we’re headed for the same sort of decline this time around. I’m just suggesting that right now is probably not the best time to be putting new money to work in the gold sector. We’ll likely have a better chance to do so in the months ahead.
Best regards and good trading,

Jeff Clark
P.S. If you’re like most people, you may already own gold stocks, bullion, or some other gold investment. But, if you’re just “buying and holding,” you could be missing out on serious gains.
I recently uncovered a way to earn up to 10x larger gains in the gold market, in a fraction of the time. And it doesn’t matter what happens to gold along the way.
I’ll reveal all the details tomorrow during a special presentation. You can reserve your spot, for free, right here.
Reader Mailbag
Today, two questions from Jeff Clark Trader subscribers new to option trading…
Jeff, I love the way your mind works and the simplicity of your presentation. However I need even more simplicity. I don’t even know how to place an option on my computer. I need to set side by side someone actually putting in an option trade.
Where should I look in my area for that kind of help?
– Ron
Mike’s note: Hi Ron, thanks for writing in – and for being a subscriber. I’ll answer your question on Jeff’s behalf.
(Before we get started, please note that what follows is NOT a trade recommendation. It’s just a demonstration of how to place an option trade.)
Placing an option trade is quite simple.
First look at the “options chain,” which you can find on the page for any individual security that has options available. On TD Ameritrade, for example, it looks like this.
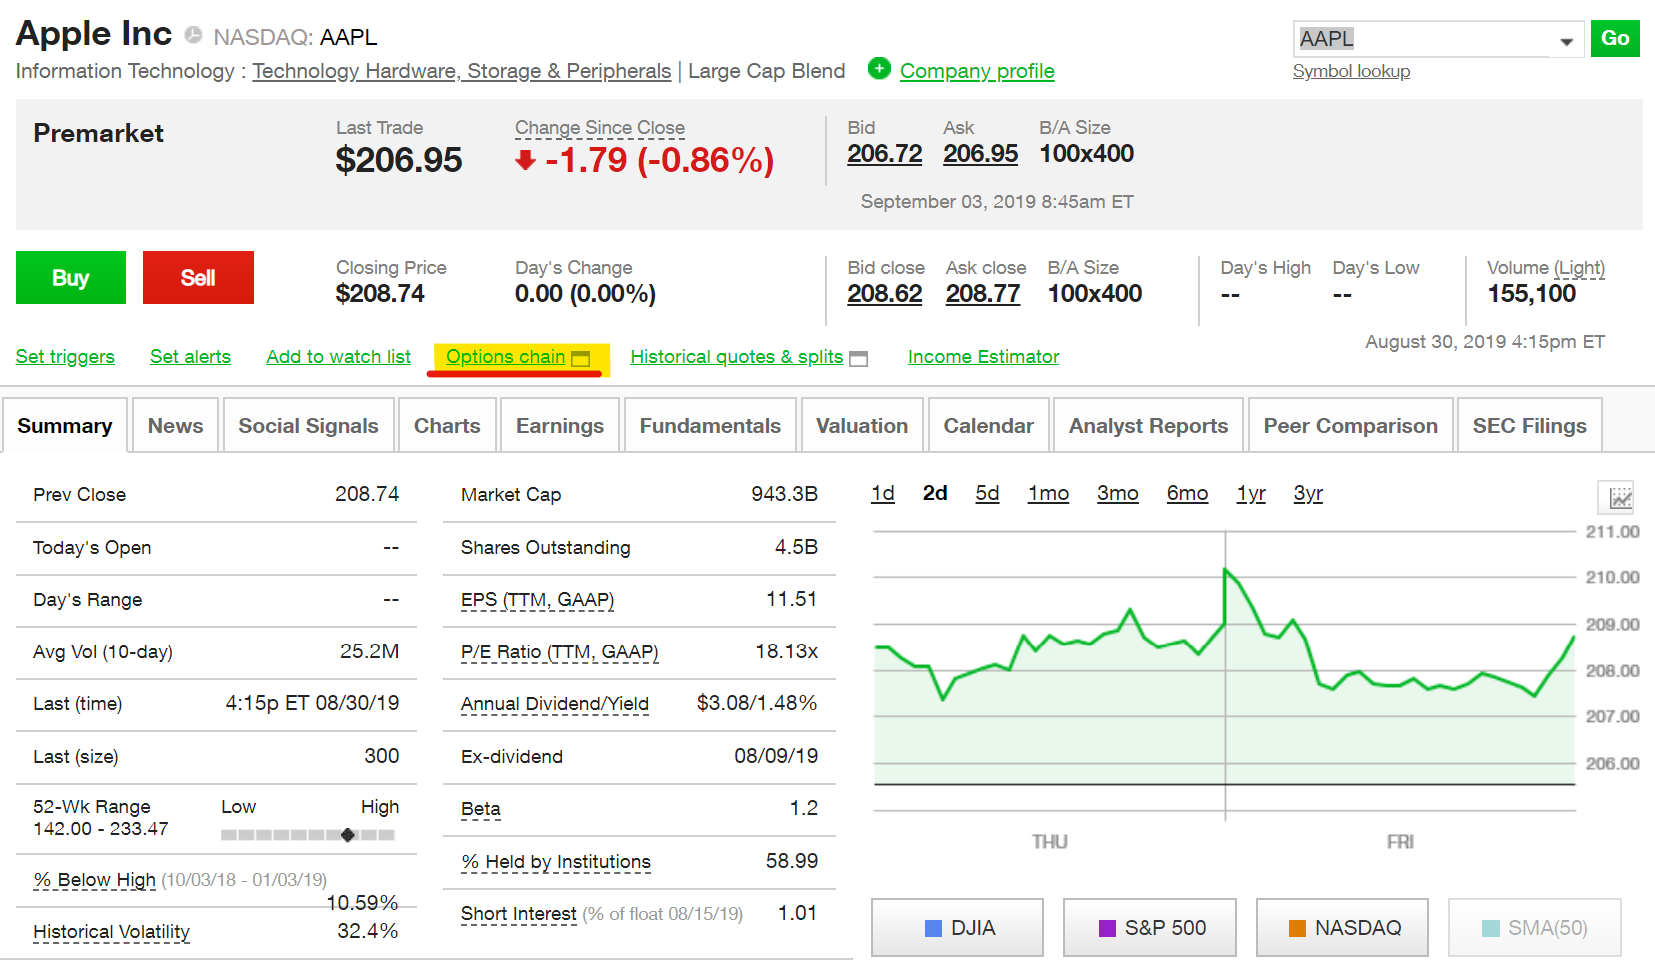
Your brokerage account may look a bit different, but the phrase “options chain” is common across all of them. That’s where you can look at quotes for both call and put options.
As you’re searching for options, be sure to apply the below filters (highlighted) which will allow you to view all the options available to trade.

And finally, the order screen. Here’s where you can choose to go long (buy) or short (sell) an option. After clicking on an option strike and expiration date, you’ll see this screen. In TD Ameritrade, it pops up on the bottom.
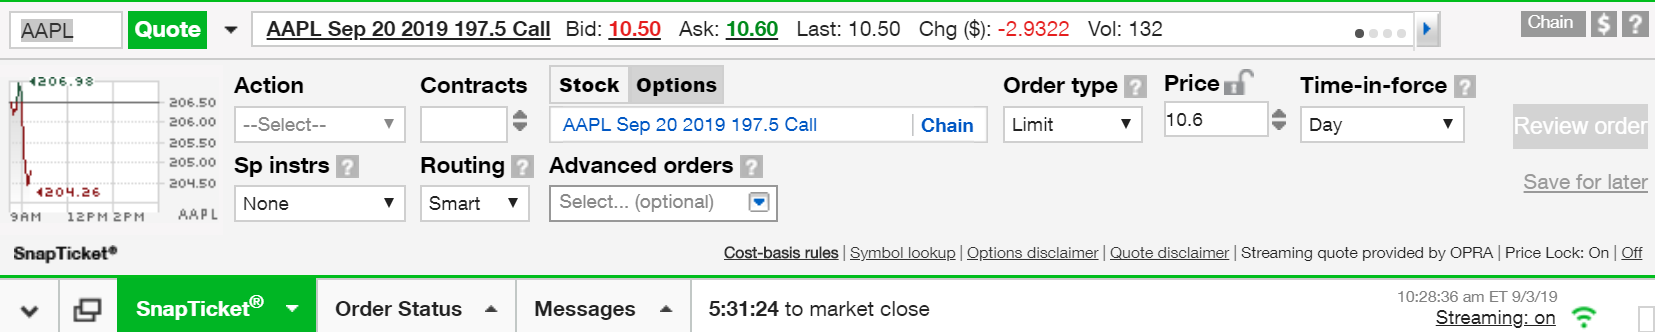
Here you can decide your trade action, how many contracts to trade, the price you want to pay, and a few other factors.
After you enter all the information, your order is put on the market. There it’s either filled and the position appears in your account, or it’s rejected for a reason the brokerage will provide.
Now, one reader has a question about a specific factor when entering options orders…
Hello, being BRAND-NEW to this, I feel a little stupid, I was just playing around and doing a fake option trade (paper) but my Brokerage firm Fidelity when placing a trade, you have to determine what the order type is.
They list the following choices: Market, Limit, Stop Loss, Stop Limit, Trailing Stop Loss, and Trailing Stop Limit. Can you please explain these?
Thank you for your time!
– Steve
Hey Steve, thanks for writing in.
Order types change how your order is executed by the brokerage. A Market order, for instance, will execute your order at the most recent market price. A Stop Loss order, which is typically used to close a position, will execute your trade based on a price or percentage change that you specify.
(You can find a full breakdown of the most common order types right here. Investopedia is a great resource for these types of questions, or if you’re just starting out and want a crash course on a specific subject.)
Now, in Jeff’s services, we always recommend using Limit orders. That’s because Jeff always issues a specific buying or selling range for each option. To ensure you get in at the price Jeff thinks provides the correct risk/reward setup, you must use a limit order and specify that same price. (For a more thorough explanation of why Jeff uses this strategy, read this essay.)
Jeff will answer more questions like these in the next Jeff Clark Trader issue later this month. If you aren’t yet a subscriber, click here to learn more about how you can sign up for the service for just $19.