
The S&P 500 made a new all-time high on Friday. The index closed near 2875 – its highest close ever. And that action now has me slightly underwater on the short position I took last Wednesday.
But aggressive traders should still consider having some small short exposure.
The Volatility Index (VIX) still looks to me like it’s setting up for a sharp spike higher. That remains my primary reason for being cautious on stocks for the short term. A sharp spike higher in the VIX usually occurs with a sharp spike lower in the stock market.
But there’s also another potential caution sign that may start flashing this week…
Take a look at this chart of the iShares iBoxx High Yield Corporate Bond Fund (HYG)…
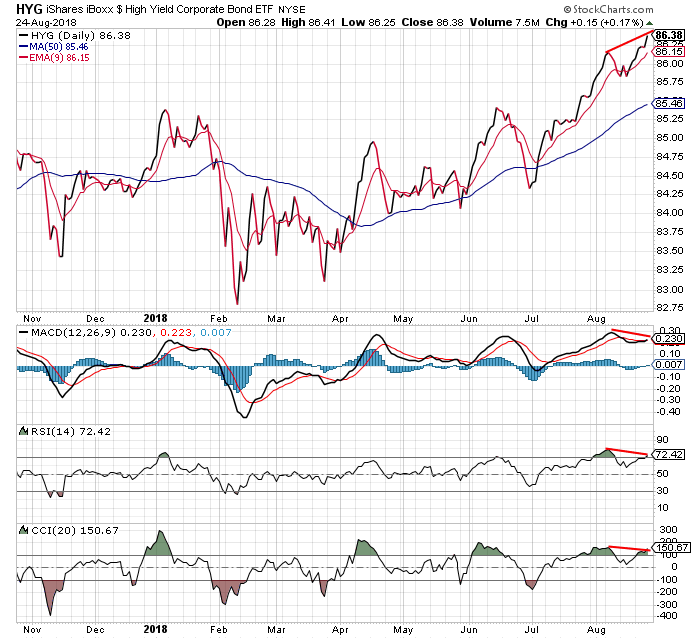
HYG holds a market basket of “less than investment grade” corporate bonds – otherwise known as junk bonds. I’ve written many times before about how the action in the junk bond market influences the action in the stock market.
So, traders can watch HYG to get a clue on the short-term action in the stock market. And, based on this chart, traders should be cautious.
You see, HYG made a new high last Friday – just like the stock market did. But you’ll notice that none of the technical indicatators for the HYG chart made new highs. This “negative divergence” is often an early warning sign of a potential reversal. So, it looks to me like HYG could be vulnerable to some selling pressure this week.
Notice also how far the 9-day exponential moving average line (the squiggly red line) is above the 50-day moving average line (the squiggly blue line). These averages rarely trade so far away from each other. HYG either needs to trade sideways for a few days so that the 50-day MA can catch up to the 9-day EMA, or it needs to fall so that the 9-day EMA can decline towards the 50-day MA.
And if we get some selling pressure in HYG this week, we’ll also quite likely see some selling pressure in stocks as well.
As I mentioned last week while writing about the VIX, things may not play out this way. So, I’m still not suggesting that traders get too aggressive with short positions.
But the look of the HYG chart is another reason to be cautious. So, you may want to be careful here with long positions as well.
Best regards and good trading,

Jeff Clark
Reader Mailbag
As always in our reader mailbag, we want to know how you’d trade the current market environment. Will the new highs sustain? What strategies will you use if they don’t?
Send in your letters right here…