Fed Chairman Jerome Powell’s latest speech at Jackson Hole made it clear that a dovish pivot was not in the works.
Since then, the doves have been crying.
Most notably, Powell commented that “restoring price stability will likely require maintaining a restrictive policy stance for some time.”
He also acknowledged that the Fed’s primary avenue for fighting inflation is to reduce aggregate demand – another term for overall economic activity. And the past week has seen several reports that the economy is still going strong…
Payrolls roughly matched expectations with the addition of 315,000 jobs in August, while manufacturing activity continues to expand at a modest pace according to the most recent ISM data.
That gives the Fed a green light to keep raising rates and reducing their $8.9 trillion balance sheet, which weighs on stocks as the Fed drains liquidity from the financial markets.
So good news on the economic front has become bad news for investors… That helps explain the 9% decline in the S&P 500 since mid-August.
But before you assume we’re amid the next big plunge in stock prices, you should peek under the stock market’s hood first…
Washed Out
With three straight weekly declines in the S&P 500, it feels like stocks can only keep falling at this point.
But that’s what makes trading bear markets so tricky. Just when you’re convinced that the next move is lower… bear market rallies can come from out of nowhere.
In fact, some of the most epic rallies over a short time have happened right in the middle of bear markets.
For example, during the “dot-com” bust the S&P 500 ultimately fell 50% from its 2000 high to the low in 2002.
But during that plunge, there were at least three bear market rallies that gained an average of 20% in just a few months or less!
Or just take 2022, for example, in the chart below.
After falling 23% on the year through mid-June, the S&P 500 went on a tear… rallying 17% in just two months before this latest swoon.

So how do we know what comes next?
Well, I put these bear and bull trends under the microscope by evaluating what’s happening underneath the hood. Participation in a trend can tell you a lot about its ability to continue or reverse.
One way I do that is by tracking an indicator called the McClellan Oscillator. This metric examines the momentum behind how many stocks are advancing versus declining on the New York Stock Exchange.
|
Free Trading Resources Have you checked out Jeff’s free trading resources on his website? It contains a selection of special reports, training videos, and a full trading glossary to help kickstart your trading career – at zero cost to you. Just click here to check it out. |
One way to utilize this breadth measure in assessing the stock market’s trend is to look at the extreme highs and lows.
That’s an indication that a trend has run its course, and to be on the lookout for a reversal.
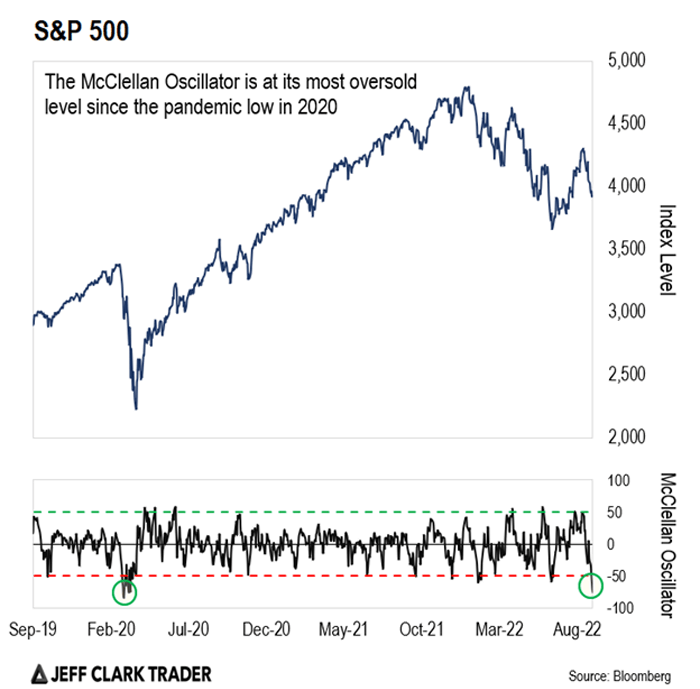
The current pullback in the stock market since mid-August made the McClellan Oscillator the most oversold since the pandemic bear market in 2020.
You can see that in the chart below…

Because of such an oversold level, it’s a good sign the market is gearing up for a rally.
However, it’s not enough to rely on any single indicator to determine market direction.
So, I’ll need to see confirmation from other measures like price action to verify these oversold readings.
In the meantime, I’m patiently waiting for the right opportunity to play a bounce.
And next week, I’ll show you the key sector on my radar right now… And how to trade it for a profit.
Best regards,
Clint Brewer
Analyst, Market Minute
Reader Mailbag
What other trends do you follow to gauge market action?
Let us know your thoughts – and any questions you have – at [email protected].