
Another week… Another news story inspiring fear, uncertainty, and doubt for bitcoin.
Turkey banned cryptocurrency payments last Friday morning. It cited illegal transactions and excessive volatility as the reason for the ban…
But the real reason, in my view, is that bitcoin is in direct competition with Turkey’s paper currency, the lira.
Turkey has an inflation rate of 16%, and its currency has fallen 65% versus the U.S. dollar over the last five years.
As a result, Turkish citizens have become some of the most crypto-savvy in the world. A recent report from Statista said that 1 in 5 Turkish citizens have bought or used cryptocurrency.
Numbers like these would naturally force a country into such a move. The combination of a weak economy, loss of confidence in the currency, and rapidly rising bitcoin prices is challenging the financial status quo in Turkey.
But, I’m shifting focus to talk to you about something else today…
Instead, I want to talk about bitcoin’s 15% drawdown in the days that followed… The mainstream media’s misinformation on what caused that drop… And a far more useful tool for trading bitcoin than just the news about yet another country’s attempted ban on crypto.
Avoid the Headlines
Since Turkey’s ban on crypto on Friday, there have been countless mainstream news pieces attributing bitcoin’s recent price drop to the ban…
Reuters: Bitcoin tumbles after Turkey bans crypto payments citing risks
MarketWatch: Bitcoin falls as Turkey bans cryptocurrency payments
Coindesk: Bitcoin Price Drops as Turkey Bans Crypto Payments Amid Currency Crisis
But the problem there is that bitcoin didn’t really begin to fall until a full 48 hours later. So, how can Turkey’s ban be solely responsible?
The answer, of course, is that it isn’t. And those flashy news headlines about bitcoin corrections and crypto bans get the clicks that keeps mainstream media in business.
The truth is that bitcoin is a pure momentum asset – and it will be for the foreseeable future. Our focus as traders should be not to follow these headlines… But instead use trading tools that give us an edge and help us see these moves coming.
Now, this isn’t to say that only technical factors matter when trading bitcoin. The hype around the Coinbase listing, for example, drove a lot of interest in bitcoin last week. More importantly, it signaled to many that bitcoin is a legitimate asset class.
I would argue this legitimacy – driven just as much by public companies like Tesla and MicroStrategy acquiring bitcoin for their balance sheets – has played a big role in getting bitcoin above $60,000 in the first place.
But it’s important for traders to use this type of information alongside technical tools to help make good trading decisions.
So today, I want to introduce a trading tool called the “volume profile,” and revisit the momentum framework I use for assets with price action like bitcoin’s.
How a Trader Should Watch the Bitcoin Chart
The volume profile is a chart overlay that simply shows the amount of bitcoin traded per price level. It clearly shows you support and resistance levels that moving averages alone cannot.
Take a look at bitcoin’s volume profile below…
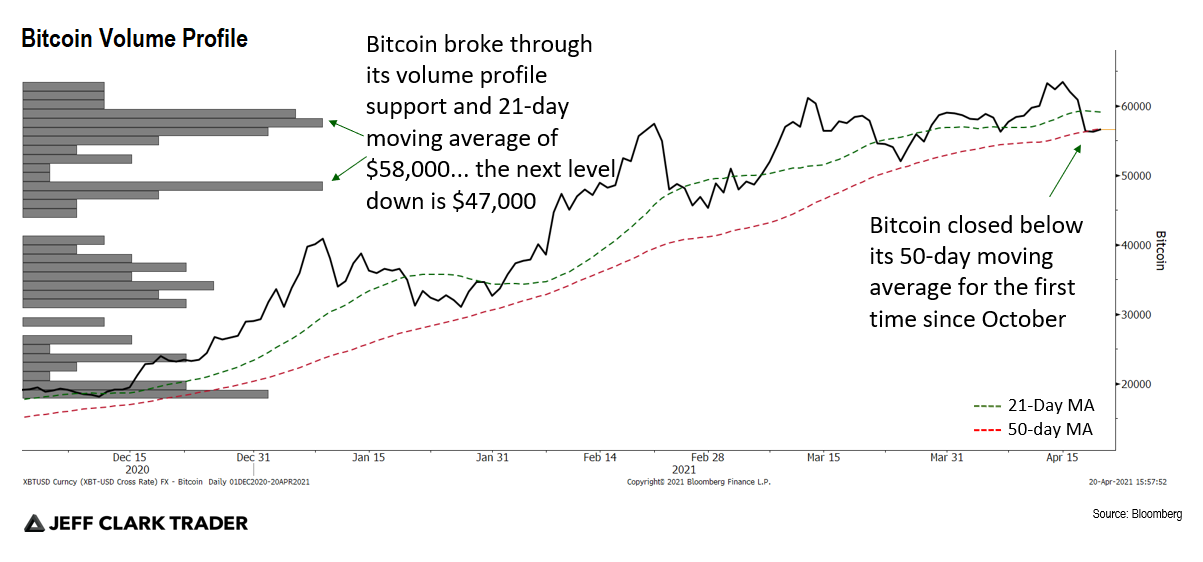
This chart shows bitcoin (black line) with the 21- and 50-day moving averages (MA – in green and red) and the volume profile overlaid to the left.
Using the volume profile tool, we can see the $58,000 area is where most bitcoin has traded since its big breakout in February – only rivaled by the $20,000 mark from November.
That makes this price a strong support/resistance level. When bitcoin lost this level, the momentum picked up and caused the selloff we saw on Saturday.
|
Free Trading Resources Have you checked out Jeff’s free trading resources on his website? It contains a selection of special reports, training videos, and a full trading glossary to help kickstart your trading career – at zero cost to you. Just click here to check it out. |
What you’ll also notice is that bitcoin sliced through its 21-day moving average on Saturday night – once it lost the support of the volume profile. The 50-day moving average is now an important technical level for bitcoin. It’s served as support for a year now and is in danger of becoming resistance.
Because of all this, I believe bitcoin is a short until it can retain that key $58,000 level. The next volume accumulation area using the volume profile method is $48,000 (15% down from today’s levels).
And as long as bitcoin trades below its 50-day moving average, where it is now, I can’t help but stay bearish on it.
Regards,
Eric Shamilov
Contributing Editor, Market Minute
P.S. Before you go, I wanted to put something important on your radar…
Right now, with most stocks soaring, Jeff Clark believes this is the best opportunity for his readers to use his FLIP technique – where you could see gains in as little as 48 hours.
He’ll be hosting a presentation next Wednesday that’ll go more in-depth on this unique trading system. He’ll even be giving away three free trade recommendations to help everyday investors get started.
I’ll be tuning into his special presentation next week, April 28 at 8 p.m. ET, to learn more about it… And I hope you’ll join in as well. Just click here to reserve your spot – you don’t want to miss it.