
The summer heat feels like it’s still going strong.
And so far, natural gas has been the best performing commodity over the last three months, rising by 50%.
With supplies tight and prices on the rise, the recent nation-wide heat wave added a seasonal demand shock that sent those prices into overdrive.
In early July, I outlined that these kinds of weather-induced demand shocks have followed a similar pattern, usually resulting in a 30-50% rise in gas prices that top out around 35 days from the start.
At the time, I pointed out that prices still had a ways to go before booking profits on gas related products… stating, “Natural gas has only risen 20% from the current heat wave… Prices can rise as high as 30-50% within 35 days before falling.”
Now, it looks like that time is almost here…
Usually, towards the end of a major move, underlying fundamentals begin to go the opposite way, while price momentum continues as the last speculators enter a crowded trade.
It’s a common trait of the hype lifecycle, and commodities are not immune.
The beginning is based on fundamentals – concrete reasons to be invested – in this case the demand shock from soaring temperatures.
The end is based on headlines and FOMO traders.
Here’s an updated chart of the current natural gas trajectory from when the heat wave started compared to the previous averages…

So far, prices have been following the same pattern…
But now, we’re approaching that 35-40-day window when prices begin to revert back to the starting point.
And it comes just as demand is reaching a seasonal peak and natural gas calendar spreads are no longer rising.
|
Free Trading Resources Have you checked out Jeff’s free trading resources on his website? It contains a selection of special reports, training videos, and a full trading glossary to help kickstart your trading career – at zero cost to you. Just click here to check it out. |
Earlier this month, I explained how the market isn’t just concerned about a spike in short-term demand from the heat wave, but it’s also worried about peak demand during the winter.
Commodity traders gauge this by following a trading tool known as “calendar spreads” in the futures market. Calendar spreads measure the difference between prices expiring at one date versus those expiring later. When calendar spreads rise, it’s usually a symptom of demand outpacing supplies, which causes commodity prices to rise.
That’s because physical users of commodities (like electric utilities) will bid up short-term prices to ensure adequate supplies, causing a rise in spreads.
Although spreads peaked on July 5, the U.S. Natural Gas Fund (UNG) continues to make new highs. This kind of divergence between calendar spreads and spot prices are a reliable sign that the end of a trend is coming soon.
From a seasonal point of view, we are also right at peak demand…
Take a look at this 20-year seasonality chart called “cooling degree days” from the National Oceanic and Atmospheric Administration (NOAA), which measures how hot the temperature was in a period of time…
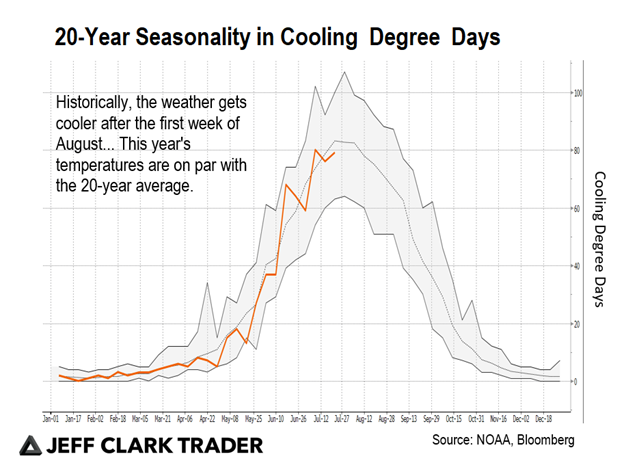
Cooling degree days (CDD) are a measure of how hot the temperature was on a given day or during a period of days. NOAA uses 65 degrees as a benchmark. So, a day with a mean temperature of 80°F has 15 CDD (80-65=15). If the next day has a mean temperature of 83°F, it has 18 CDD.
The dotted line represents the 20-year average of cooling degree days. The orange line shows the number of cooling degree days this year so far. And the gray area between the two solid lines represents the high and low during the correlating period at the bottom of the chart.
The lines peak right at the end of July up to the first week of August when temperatures start to cool.
All of this is coming together just as gas prices are at their highs.
Right now, UNG is trading around $13.75. Since the onset of the heat wave, its volume weight average price (VWAP) is at $12.75, or 7% below current levels. VWAP is a trading benchmark that gives the average price a security has traded at throughout a period, based on both volume and price. It provides insight into both the trend and value of a security.
If history repeats itself, that level is unlikely to hold and $11.50 a share would be a better target as we approach the end of the summer.
As for natural gas producers, they have already been on the decline. Stocks like CNX Resources (CNX), EQT Corporation (EQT), and Cabot Oil & Gas (COG) have fallen around 10% since July 2.
Jeff Clark has mentioned many times that commodity producers tend to lead commodity prices. If that’s the case, then UNG is just about fully priced in.
Regards,
Eric Shamilov
Contributing Editor, Market Minute
P.S. Tonight, at 8 p.m. ET, tune into Jeff Clark’s free trading presentation where he’ll finally be sharing the technique he’s used to create a fortune for himself during turbulent times. In fact, it’s the same technique he once used to make enough money to retire with just a single trade during the dot-com meltdown.
In his presentation, he’ll also be going over an incoming rare market move that’s only happened two other times in half a century… and it could very well wipe out your capital gains.
To prepare for this move, and even find out how you could make a fortune during this upcoming event, just click here. Jeff will be giving away a free trade recommendation to get you started now. But please, make sure to reserve your seat… we’re running out of time.
Reader Mailbag
Based on the previous year’s patterns, do you think the gas trend is coming to an end soon? Or will factors like reopening impact prices?
Let us know your thoughts – and any questions you may have – at [email protected].