Dear Reader,
Here’s what to look for in the action today…
General Trends
The first trading day of May is typically a bullish day for the market. The S&P closes higher something like 70% of the time, and the average gain is around 0.5%. Most of the technical indicators are now back in neutral territory. So there’s room for them to move higher before getting overbought.
If the bulls are going to make a run at new all-time highs, then today is a good day for them to do it.
Here in the Market Minute, I show you how the major markets are setting up for the day… and which to watch. It’s how I’m preparing for the trading day.
Let’s see what’s happening with stocks…
Stocks
The S&P 500 blasted higher early last week. Most technical conditions got overbought – some indicators even approached extremely overbought territory. My concern last Wednesday was that if the stock market continued higher then several indicators would set up to trigger “sell” signals.
I argued that the healthiest thing that could happen for the market was for stock prices to pull back a bit and allow the technical indicators to back off from their overbought conditions.
That is what has happened.
The S&P 500 is only a few points lower from where it closed on Tuesday. But the three days of consolidation have moved most indicators back to neutral.
For example, look at this chart of the McClellan Oscillator for the NASDAQ (NAMO)…
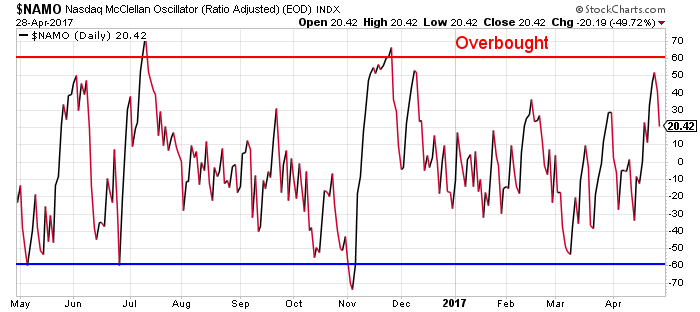
The NAMO helps to measure overbought and oversold conditions. It’s not so important to know how the oscillator is calculated. What’s important is to know that when the NAMO drops to -60 or below, stocks are quite oversold and likely to bounce, at least in the short term. When the NAMO climbs above 60, stocks are overbought and likely to fall.
After reaching just above 50 last Tuesday, the NAMO has pulled back to about 20. That’s a neutral reading. So, now there’s plenty of room for the broad stock market to push higher again without the concern of quickly pushing into overbought territory.
At the same time, let’s not forget about the situation in the Volatility Index (VIX) options I wrote about last week (see “A Better Crystal Ball for Traders”). VIX calls for May are still much more expensive than the VIX puts. Traders are looking for a higher VIX over the next two weeks, and a higher VIX usually means a lower stock market.
So, the most likely scenario for the market this week would be to see strength early on – like today and tomorrow – followed by weakness towards the end of the week.
Gold and Gold Stocks
Friday was a good day for the gold sector. I suspect we’ll get some follow-through action to the upside today. But it still doesn’t look like the sector is ready to race away to the upside in a strong intermediate term rally. Most likely, gold stocks will bounce for another day or so. Then we’ll get a few more days of choppy action.
High Yield Bonds
The high yield bond sector (junk bonds) continues to trade well. There are some negative divergences creeping into the daily chart of HYG – the high yield bond ETF.
Remember, the action in HYG tends to lead the action in the broad stock market anywhere from a few days to about two weeks. If HYG starts to roll over and decline from here, then it should be an early warning sign of an impending stock market decline.
So, keep an eye on HYG this week.
I’ll update regular readers on these trends throughout the day on Jeff Clark Direct.
Best regards and good trading,

Jeff Clark
P.S. I love to hear your feedback. Send your comments and questions to me right here.